
 I was looking at some numbers in anticipation of a mid-season review of the Reds and noticed something really interesting about Jason LaRue. Jason's struggles have been well documented, most recently on this blog in my June 2006 Review. Through 114 at-bats, here are LaRue's numbers: 0.184 batting average, 0.293 on-base percentage, and a 0.307 slugging percentage, which makes for an even 0.600 On Base + Slugging Percentage (OPS). Pretty terrible season for him thus far, right?
Well, maybe he hasn't been swinging that badly. First, let's look at some of the graphs over at fangraphs.com. Compared to last year (and the year before for that matter), his walk rate is up and his strikeout rate is down this year. But even more interesting is this graph of LaRue's balls hit into play:
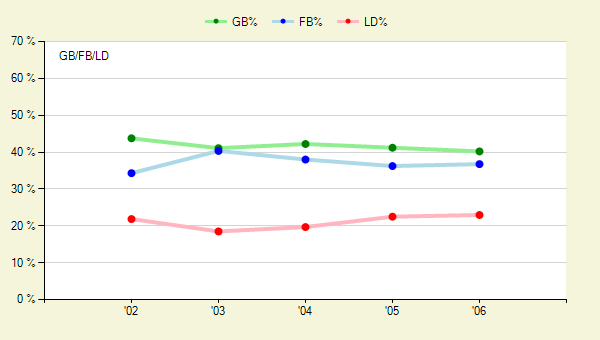 Compare his ground-ball, line-drive, and fly-ball percentage from this year to last year. There's almost no difference. LaRue's batted-ball types are almost identical to his solid 2005 season. Typically, when a player suffers from a dramatic slump or loss in ability, you'll see a substantial change in these numbers. In this case, nothing about what he does with the bat seems to be different. He's hitting balls the same way, he's walking at the same rate, and he's striking out at the same rate. The difference appears to be the outcome--he's just not "hitting them were they ain't."
Using PrOPS
Another way of looking at these same sorts of data is to use J.C. Bradbury's PrOPS statistic. It's my new favorite stat for offense. It's similar to defense-independent pitching stats in that it attempts to separate what the batter does with the bat itself from the fielding & luck (good and bad) with which he has to contend. What it effectively does is take the raw batting outcomes -- % walks, %strikeouts, %flyballs, %groundballs, and %line drives -- of a hitter and estimate what his OPS should be with an average amount of luck. Bradbury's work has shown that this approach has strong predictive power, and explaining roughly 80% of variation in OPS. Furthermore, individuals that perform well below or above their PrOPS one year tend to perform much closer to it the next year--just what you'd expect if this stat helping you decipher lucky performances from legitimate performances. So what does it say about Jason LaRue?
Right now, PrOPS says that LaRue's OPS should be about 0.846--compare that to his actual OPS of 0.600! That difference (0.846-0.600=0.246) is the largest difference between OPS and PrOPS among all active major league baseball players with at least LaRue's number of plate appearances this season. It's staggering. And it suggests that LaRue has been very solid at the plate despite the bad outcomes of his batted balls (his BABIP is a miserable 0.207).
Now my first thought when I saw this was that perhaps PrOPS, a fairly new statistic, just doesn't work well on Jason LaRue. But this doesn't appear to be the case. His 2005 PrOPS was 0.838, which is pretty close to his actual OPS of 0.805. Similarly, LaRue's 2004 PrOPS was 0.790, which again is pretty close to his actual 2004 OPS of 0.765. Therefore, at least in the past, LaRue has been quite predictable by the PrOPS method. So I think this conclusion--that LaRue has hit the ball far better than his traditional stats say he has this year--is pretty well supported.
The problem I have is that, living in Arizona, I don't get to see very many games. Of those I've seen in which LaRue has played, I don't recall him looking all that lost at the plate--even as he went 0-4. But I'd be very interested to hear if you folks who watch far more games than I do have seen something consistent with this view of LaRue. Has he been hitting a lot of hard hit balls right at infielders and outfielders? My guess is that if someone were to go back through all the games, they'd see that this has happened quite a lot this year compared to last year.
Other quick PrOPS (just 'cause I love this stuff)
If you're curious, other unlucky Reds according to PrOPS include Adam Dunn (0.923 OPS vs. 1.066 PrOPS), Javier Valentin (0.601 OPS vs. 0.731 PrOPS), and Ken Griffey Jr (0.828 OPS vs. 0.908 PrOPS). Happily, the only Reds who appear to have been particularly fortunate in their performance are Chris Denorfia (1.306 OPS vs. 0.651 PrOPS) and Ray Olmedo (0.826 OPS vs. 0.646 PrOPS), and neither has more than a handful of at-bats. Encouragingly, breakout players like Dave Ross (1.065 OPS vs. 1.042 PrOPS) and Brandon Phillips (0.817 OPS vs. 0.814 PrOPS) look to have improved their actual hitting, and haven't just been lucky!
Who's the second hardest-luck guy in baseball behind Jason LaRue? Barry Bonds, who currently has a very good 0.975 OPS and a terrifying 1.215 PrOPS. What happens if he starts to get lucky in the second half? Yikes.
Lucky players on other teams around the majors include Gary Matthews Jr. (0.914 OPS vs. 0.783 PrOPS), Joe Mauer (1.008 OPS vs. 0.879 PrOPS), Matt Holliday (0.973 OPS vs. 0.849 PrOPS), and Freddy Sanchez (0.931 OPS vs. 0.825 PrOPS).
The top seven (qualified) hitters in baseball this season, according to PrOPS: Albert Pujols (1.196 PrOPS), Travis Hafner (1.143 PrOPS), Jason Giambi (1.127 PrOPS), Jim Thome (1.114 PrOPS), Manny Ramirez (1.103 PrOPS), David Ortiz (1.076 PrOPS), and... our man, Adam Dunn (1.066 PrOPS).
What Jason is missing this year is doubles.
ReplyDeleteLast year Larue hit 14 HRs and 26 doubles in 417 plate appearances.
This year he has 4 HRs and 3 doubles in 131 PAs.
He is hitting a HR every 32.75 plate appearance this year, compared to every 29.79 appaearance last year. A small drop.
However, he is doubling once every 43.66 appearances this year, compared to once every 16.04 appearances last year. A big drop.
Of course this drop in doubles hurts his slugging percentage dramatically.
Mike
The question there, of course, is why his doubles are down. Is it that he's not hitting balls hard into the outfield? Or is it that he's hitting them out there, it's just that they're getting caught? The batted ball data indicates the latter is the case. -jinaz
ReplyDeleteI don't buy that it's 'luck'. Watched him again today: 3 ks.
ReplyDeleteAbout half of doubles are gap shots, and half are hard hit down the line. Of course gap shots are caught if they aren't hit hard. Hits down the line are fielded by 1st or 3rd basemen if they aren't hit hard. To me, the fact that Larue isn't getting doubles shows he is not hitting the ball very hard.
Raw batted ball data: gb, fb, and ld, doen't fully tell the story....in my opinion.
Look at ISO, isolated power. Lurue has dropped from 20 or 25 points above league average the last three years, to 25 points below league average.
Also, his BABIP numbers are way down. League average remains around .300. Previously, Larue has gotten base hits at a rate slightly better than league average on balls in play. This year, his BABIP is almost 100 points BELOW league average. I don't think that's 'luck', that shows a guy who isn't hitting the ball very hard.
As for Griffey and Dunn being 'unlucky', I wonder is their average for balls in play numbers get screwed up since they pull so much, and many teams defend them with a huge shift. That may drastically reduce their BABIP % since there is one more defender availabloe to get them out.
Mike
Thanks for the comments. I'm not surprised to see skepticism, as this is a pretty novel way of looking at player performance. And if I'm right, it's also a fairly rare case, as batted ball data will typically be right in line with "scorebook" data like hits and doubles. Some points:
ReplyDeleteI don't buy that it's 'luck'. Watched him again today: 3 ks.
Yeah, he definitely had a bad game. But from a season-long perspective, as I mentioned, his strikeout rate (prior to today at least) is actually down compared to last year. So there's not much evidence that strikeout rates have anything to do with his struggles this year.
About half of doubles are gap shots, and half are hard hit down the line. Of course gap shots are caught if they aren't hit hard. Hits down the line are fielded by 1st or 3rd basemen if they aren't hit hard. To me, the fact that Larue isn't getting doubles shows he is not hitting the ball very hard.
Well, his line drive percentage is the same now as it was last year. Line drives are, by definition, hard hit balls. So, to me, it looks like he's still hitting the ball pretty hard. The whole point of the PrOPS work is that hits, doubles, etc, are all part skill and part luck. By ignoring what fielders do and predicting performance based on batted ball types, PrOPS allows us to at least identify cases in which there's a mismatch between batted ball types and performance.
Your definition of what makes a double is correct, but perhaps incomplete. Doubles are hard hit balls down the line or in the gaps that the fielders do not field. Whether the fielder catches the ball depends in part on their skills & positioning, and in part upon "luck" in terms of where specifically the ball ends up going. Hitters have some control over this, but "luck" is also an important element of where the ball ends up going.
Raw batted ball data: gb, fb, and ld, doen't fully tell the story....in my opinion.
I wouldn't say they do either. But neither do typical "scorebook" stats like hits & doubles. It's possible to get a base hit on a terribly hit slow roller, or a lucky flare just over the infielder. It's possible to get a double on a misplayed ball in the outfield, and it's possible to lose a double by being subject to excellent defense, or to be "unlucky" enough to hit the ball close to where a fielder is playing.
Look at ISO, isolated power. Lurue has dropped from 20 or 25 points above league average the last three years, to 25 points below league average.
Sure, but again, extra base hits are scorebook stats that are dependent on a combination of LaRue's skill, fielder's skill, and luck. If LaRue has been unlucky in terms of his extra-base hits--and it is possible that he has been--his ISO will suffer.
Also, his BABIP numbers are way down. League average remains around .300. Previously, Larue has gotten base hits at a rate slightly better than league average on balls in play. This year, his BABIP is almost 100 points BELOW league average. I don't think that's 'luck', that shows a guy who isn't hitting the ball very hard.
With pitchers, we usually view BABIP as being almost entirely due to luck and the fielders behind them. Hitters do have more control over their BABIP than pitchers. But it is still a statistic that fluctuates from year to year on hitters, apparently due to both the fortunes of the hitter and opposing team defensive ability. When I see a guy with a very low BABIP, but a guy who also has nearly identical fb/gb/ld rates, that seems to me to be a strong indication that he's been subject to some terrible luck.
As for Griffey and Dunn being 'unlucky', I wonder is their average for balls in play numbers get screwed up since they pull so much, and many teams defend them with a huge shift. That may drastically reduce their BABIP % since there is one more defender availabloe to get them out.
That's a really interesting point, and is worth looking into. As a case example, I can tell you that David Ortiz, who receives that sort of shift as well (I've heard it called the "Ortiz Shift"), currently has an OPS 0.071 lower than his PrOPS. Not as severe an effect as with Dunn and Griffey, but still fairly large. However, Ortiz's OPS was a fairly small 0.033 less than his PrOPS in 2005, and in 2004, his OPS was actually 0.037 higher than his PrOPS. So that anecdote, at least, doesn't seem to indicate that the shift alone can cause a large effect on BABIP (though I have little doubt that it does have an effect).
It's worth noting that Ortiz's BABIP has tracked his OPS-PrOPS difference very well over the past three years. In '04 he had an unusually high BABIP (0.328), which is consistent with him being a bit lucky. In '05, his BABIP was pretty close to average (0.309), as was his OPS-PrOPS. And in 2006, his BABIP is a fairly low 0.266, which is consistent with PrOPS saying his OPS is "low" (if a 1.008 OPS can be low...).
-J in AZ
I also think the shift is worth looking at in more detail. Hard to do since it is not tracked in any official stat. With a runner on second, I think you can assume it is not used since the third basemen has to stay put to cover third. Otherwise, you would have to actually pull up video archives from MLB TV and do your own stats. My personal observation is that the shift has been effective against Griffey and Dunn.
ReplyDeleteThanks for the interesting discussion! I really enjoy reading your site. Keep up the great work.
I hope you are right, and that Mr. Larue's luck changes....
Mike
Thanks again for the great analysis.
ReplyDeleteRight or wrong, your assessment makes me wonder what Krivsky et al. are thinking about LaRue. Or perhaps more importantly, what other teams are thinking about LaRue.
Is there any correlation, as LaRue asserts, between his performance and his irregular playing time? From what you've seen of PrOPS, are the unluckiest players the ones who are in platoon situations like LaRue?
John,
ReplyDeleteJust realized that I never responded to this! I don't know if you'll ever looked here again, but:
In the very little time that I've looked at this statistic, it is the case that players with fewer numbers of at bats tend to have the largest OPS-PrOPS difference. That's just sample size issues, though. Regular playing time is a bit harder to get it. But if I had to guess, I'd say that regular playing time is likely to improve the hitter's actual performance (both OPS and PrOPS should get higher), not make him more likely to be lucky. -jinaz
Larue's 'bad luck' continues.
ReplyDeleteFrom the All-Star break thru 8/15, he is hitting .167. He has 7 hits, 10 Ks, and 9 walks in 51 plate appearances. His OBP since the break is .352, which is pretty good...but
This is generally batting 7th or 8th, which accounts for the walks. (Often with 2 outs, to get to the pitcher.) In this situation, the other team has chosen to pitch around him, and Jason getting to 1st with a slightly worse hitting pitcher up next is not helpful in run production.
I question whether BABIP is useful in evaluating hitters. Why would we want to analyze a % that does not include home runs when looking at a hitter? Isn't BABIP used more to see if a pitcher is getting 'lucky' or not on balls hit in play? With a hitter, it seems less useful, since we want to include HRs.(See this thread- http://www.redszone.com/forums/showthread.php?t=49808&highlight=BABIP
Looking at LaRue's other #s on fangraphs, his line drive rate has dropped in the last month, and he still is striking out at a fairly high rate.(well above MLB average)
I just wonder if he is either hurt, or having 3 catchers splitting time has ruined his timing. However when Ross was on the DL, LaRue hit very poorly, even with more playing time.
Whatever the cause, I don't see how we can carry a .179 hitting position player in the lineup and hope to make the playoffs.
Hi Mike,
ReplyDeleteI apologize for not replying sooner, but somehow your post got stuck a few notches down on my to-do list. And I'm running way behind.
You're right that things certainly haven't been looking up for LaRue, and it's been very frustrating to see. As you pointed, his numbers are up a bit since the all-star break are better (0.687 OPS), but still well below what we should expect from him. His 0.342 OBP in that time is driven almost entirely by his walk rate, which is way up since the break. Maybe he's not getting pitches to hit? You cite his place in the batting order, but that's not really much of a change from previous years or even the first half, is it? His K-rate on the season is still at its lowest since 2000, though it has been rising a bit lately.
In terms of his PrOPS vs. OPS, they're relatively unchanged. His PrOPS has increased from 0.846 to 0.862, while his OPS has increased from 0.600 to 0.630. Roughly mirror-image shifts over the course of 64 at-bats. I did expect those numbers to get closer together, but we're still in a situation where he has gotten only 178 AB's this season. That's still a fairly small sample, and could be why we're seeing such a big difference. And frankly, with only 64 AB's since the last time I looked at these numbers, he hasn't had much of a chance to put a huge dent in his rate stats.
Anyway, all things considered, I still think that bad luck may be playing into his performance. But I am surprised to not see something of a resurgence. One thing that I'd really like to do this offseason is go back and look for other players who have had similar deviations beteween PrOPS and OPS prior to this year and see what happens to them in subsequent years. Not much has been done with this stat yet, and a such a study could be very informative.
I absolutely agree about the difficulty of carrying a player like LaRue on a playoff-contending(?) team. Bad luck or no, his performance has been miserable and has certainly hurt the Reds. Thank goodness for David Ross's career year...but I'm feeling incredibly uncertain about what is going to happen with those two players next season. I expect LaRue to come back to some degree, but I also expect Ross to decline. How much is anybody's guess.
As far as BABIP goes, you're absolutely right that it's typically used for the evaluation of pitchers as part of the suite of diagnostic defense-independent pitching stats. The only reason I mentioned it was in response to your comment about LaRue's very low BABIP. Nevertheless, it can be used for hitters, just not quite in the same way. Hitters do have some control over their BABIP, but there is still a significant component of BABIP's variation due to luck. And, happily, it (a scorebook-based stat) tends to track the deviation between PrOPS and OPS (a batted balls-based stat) pretty well, which strengthens my trust in PrOPS as being a useful stat. -j
'Course, the moment I write that he has hurt the Reds this year, LaRue comes through with an 11th inning home run to push the Reds to only 2.5 games back of the Padres!
ReplyDelete