
The best teams overall were Florida (at a ridiculous $200k/marginal win), followed by Minnesota, Colorado, and Oakland, all of which were in the $1.1 to $1.2 million/marginal win range that seems to set apart the most efficient ballclubs from the rest of us. After those four teams, there's a substantial jump up to San Diego at 1.5 million/marginal win. The Cubs were by far the most inefficient team in the major leagues, winning only 66 games despite a $94 million payroll (an atrocious $4.9 million/marginal win). The Yankees were second worst--they won 97 games (tied for most in majors), but spent $195 million to do it ($3.8 million/marginal win). The highest payroll in the top-10 overall most efficient teams belonged to the Detroit Tigers, who had an $83 million payroll this year, but won 95 games for a cost/marginal win of $1.6 million.
So, was there a formula about how to build an efficient ballclub in 2006? To take a quick'n'dirty stab at this question, I compared the contributions of team offense (runs scored) and team defense (runs allowed) to their cost/marginal win totals. Here are the results:
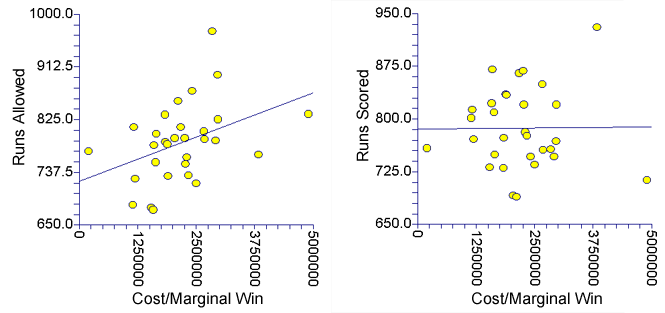 There is no clear relationship between runs scored and payroll efficiency as measured by cost/marginal win. However, you see a different story when it comes to runs allowed -- the most efficient teams tend to be those teams that allow the fewest runs. This effect is significant (t=2.30, P = 0.029), though it should be emphasized that the relationship is not very strong and leaves a lot of unexplained variation (R2 = 0.16).
These results -- despite admittedly being a bit superficial -- do indicate that efficient teams tend to be those with good pitching and defense, and that offense has next to no effect on payroll efficiency (or, to put it another way, efficient teams have offenses that differ little from those of inefficient teams). Taken a step further, the suggestion is that the most efficient use of payroll is to invest in your pitching.
To investigate this further, I pulled team WPA (Win Probability Added) totals for each major league team from fangraphs.com. This allowed me to break down, within each team, the relative contributions of hitting, starting pitching, and relief pitching to a team's cost/marginal win ratio. Once again, hitting showed absolutely no relationship (P=0.99, R2 = 0.00), but there was a bit more to the relationships between starting or relieving and cost/marginal win:
 While there appears to be a slight effect on the bullpen, it is nonsignificant (t = -0.72, P = 0.48, R2 = 0.02). The stronger effect is among the starters. Efficient teams in 2006 were those teams that had the best starting pitchers, as measured by their contributions to team's wins through WPA. The effect was significant (t = -2.8, P = 0.008), and explained a reasonable, though still fairly small, amount of the variation in cost/margin win (R2 = 0.22).
The conclusion from this quick study seems to be that teams should invest in starting pitching above all else. Nevertheless, I'll throw out a substantial caveat: many of the most efficient teams got excellent performances from very young, very cheap starting pitchers. The Marlins' staff (Willis [4.3m], Olsen [327k], Johnson[327k]) is a prime example, as is the Twins' (Santana [8.7m], Lariano [327k], Bonser [327k]) and the Athletics (Zito [7.9m], Haren [550k], potentially Harden in the playoffs [1.3m]).
So it's not necessarily the case that efficient teams are investing their money in their starters. Instead, they could be developing young starters -- and that the presence of good, young starters has such a large effect on winning that it drives the effects we're seeing with the payroll efficiency numbers. To really tease this apart, I'm going to need to do some additional work -- in a future post, I will try to revisit this by investigating actual payroll distribution (starters vs. bullpen vs. hitters) and seeing how those payroll decisions influence overall payroll efficiency.
Interesting stuff. One question: when comparing offense and defense, did you look at just salary spent for offense and salary spent for defense?
ReplyDeleteNot sure why it would be meaningful if you didn't.
No, I didn't -- that's what I was getting at in my final caveat, and is the logical next step of what to do. It's just that the data aren't as readily available for that study. I plan to do it in the future -- I whipped up the above little study in about an hour's time.
ReplyDeleteI still think these data are meaningful though. The question these data answer is this: what are teams with high payroll efficiency good at? The answer is that they tend to have better starting pitching than less efficient teams. Otherwise, they're the same. Same offense, same bullpen, and by extension from the bullpen data, they have the same fielding ability. It's just that efficient teams have better starters than inefficient teams.
The cause of that finding is still at question. Is it that efficient teams are investing their money in their starting pitching? The Twins have done that to an extent, with both Santana and Radke making over 8.5 million, which accounts for 28% of their total payroll (granted, their other two top starters are making the league minimum). Or is it that teams that get good, cheap starting pitching tend to perform better, and thus are more efficient? I can't answer that with these data, but I do plan to follow this up later this offseason.
-j
I'll be writing about this subject in the THT Annual, but it's pretty simple: young pitching making the minimum.
ReplyDeleteI'll be interested to see your conclusions, and to see how well they jive with what I come up with in my own work. Thanks for visiting! -j
ReplyDeleteQuite interesting! Is it that efficient teams are investing their money in their starting pitching?
ReplyDeleteIt's kind of hard to say, based on this little analysis. I tend to think that the majority of the effect is that efficient teams have good, effective young pitching making very little money. And that's kind of hard to do, as pitchers are so difficult to project and develop reliably. -j
ReplyDeleteit's pretty simple: young pitching making the minimum.
ReplyDelete-------------------------
pauloscar
Highly relevant, efficient advertising to forum, blog, wiki and other types of web sites. Drive large number of visitors to your website and build quality links.
http:// http://www.widecircles.com