
Friday, March 31, 2006
Out of the Park Baseball Release Date
While this is not necessarily related to "real" baseball, one of the most enjoyable computer games I've encountered, Out of the Park Baseball, annouced the release date of its next version today: May 31, 2006. As in previous versions, this game allows you to take over the role of a manager/GM of a major league baseball team, sign free agents, cope with injuries, negotiate contract extensions, and develop young players into Hall of Famers as you try to guide your team to long-term success. It features a reasonably sophisticated statistical engine (e.g. incorporates Defense Independent Pitching Statistics in its modeling of pitcher performance), good AI, and unpredictable (at times) players. This new version is a complete rewrite. Compared to previous versions, it features a more flexible league system, more realistic scouting processes, and an overhauled interface (among other things). If this sort of thing sounds interesting to you, I'd encourage you to go check it out. You can download and play version 5 (2003) right now to get a feel for what the game is all about. -j
Great American Ballpark is Not a Hitter's Paradise
As I mentioned in last night's post, I have really enjoyed Orel Hershiser as a commentator over the past two BoSox ST games I've watched. He is far more insightful that most of the color guys they have in that booth and brings a knowledgeable coach's perspective. But there was one thing he kept harping on that I found quite frustrating: his argument that Great American Ballpark is a severe hitter's park. He repeatedly compared it to the Ballpark in Arlington, which he cited as a major reason why the Rangers have had trouble developing a solid pitching staff over the years.
He may be right about Arlington, but the data don't support his argument for GABP. Let's do a quick comparison of these two parks. I'll also throw in Coors Field, as that's the other park that was mentioned in that conversation (thank you Marty).
First, let's look at the composite park factors reported in Baseball Prospectus's 2006 Annual, along with their "categorization" on that park. These park factors can be read as the adjustment one should make to a team's offense when they play in this park. A value below 1.0 indicates that a team will score fewer runs that normal, while a value above 1.0 indicates that teams will score more runs than normal.
GABP: 0.988 (slight pitcher's park)
Arlington: 1.067 (severe hitter's park)
Coors Field: 1.122 (severe hitter's park)
Which one is not like the others? Coors Field has a longstanding reputation as a ridiculous place to play baseball because the offense is so inflated. Arlington, similarly, has a well-justified reputation as a hitter's park. But what's going on with GABP? All we ever hear about it is that it is highly conducive to homers, which is supposed to be why Eric Milton has gotten killed there (which is partly, though probably not entirely true). Why isn't that showing up in the data?
The Hardball Times' 2006 Annual has an excellent article by Dave Studenmund about ballparks and how they affect the game. In it, he cites a superb set of park factors that are available on the web by a guy called U. S. Patriot. If you go to his site, you'll find the park factors below. These are based on multiple years of data for each park, corrected for sampling error (regressed to the mean), and are separated into a park factor for total runs allowed (RunPF) and a park factor for home runs (HRPF):
To pursue this further, I'll refer back to Studenmund's Hardball Times chapter where he reports some novel data on batted ball types and results in different stadiums. He reports the average value, in terms of the number of runs, of three batted ball types in each stadium: outfield fly balls (OF), ground balls (GB), and line drives (LD). A value above 0.00 indicates that this batted ball type results in more runs than in a typical stadium, while a negative value indicates that this ball type results in fewer runs than average. Data on our three stadiums:
Conclusion & Looking Forward
Yes, GABP is permissive when it comes to home runs. But it's not uncontrollable. The problem we're encountering has more to do with the pitchers we have on our team than anything else. As these data indicate, pitchers that induce fly balls more often than ground balls (last year = Milton) will struggle in GABP, just as they would at Wrigley, Fenway, and U.S. Cellular.
But as each of the teams at those three stadiums have shown, it is very possible to build effective pitching staffs in those ballparks. The key is to focus on pitchers that can exploit the ballpark's strengths. Great American Ballpark is, in Studenmund's words, "death to ground balls," with the most negative effect on ground ball-based runs of any park in baseball. If we build a team around pitchers who can keep the ball on the ground, we can exploit this characteristic of our park in our favor. Last year, Harang, Arroyo, Claussen, and Williams all allowed more ground balls than fly balls to the outfield (ok, Arroyo allowed equal percentages of each; source=hardball times '06 annual, pp.330-332), which gives me some hope for our rotation moving forward. -j
He may be right about Arlington, but the data don't support his argument for GABP. Let's do a quick comparison of these two parks. I'll also throw in Coors Field, as that's the other park that was mentioned in that conversation (thank you Marty).
First, let's look at the composite park factors reported in Baseball Prospectus's 2006 Annual, along with their "categorization" on that park. These park factors can be read as the adjustment one should make to a team's offense when they play in this park. A value below 1.0 indicates that a team will score fewer runs that normal, while a value above 1.0 indicates that teams will score more runs than normal.
GABP: 0.988 (slight pitcher's park)
Arlington: 1.067 (severe hitter's park)
Coors Field: 1.122 (severe hitter's park)
Which one is not like the others? Coors Field has a longstanding reputation as a ridiculous place to play baseball because the offense is so inflated. Arlington, similarly, has a well-justified reputation as a hitter's park. But what's going on with GABP? All we ever hear about it is that it is highly conducive to homers, which is supposed to be why Eric Milton has gotten killed there (which is partly, though probably not entirely true). Why isn't that showing up in the data?
The Hardball Times' 2006 Annual has an excellent article by Dave Studenmund about ballparks and how they affect the game. In it, he cites a superb set of park factors that are available on the web by a guy called U. S. Patriot. If you go to his site, you'll find the park factors below. These are based on multiple years of data for each park, corrected for sampling error (regressed to the mean), and are separated into a park factor for total runs allowed (RunPF) and a park factor for home runs (HRPF):
Park RunPF HRPFIn Patriot's data, 100 is average. Therefore, GABP is still showing a slight negative effect on overall runs scored. Nevertheless, here we do see that home runs are positively influenced by GABP...but not as badly as in Arlington or Coors. Since HR's are inflated, other sources of offense must be concurrently depressed in GABP in order to result in a net neutral park in terms of overall runs scored.
GABP: 99 106
Arlington: 106 107
Coors Field: 115 114
To pursue this further, I'll refer back to Studenmund's Hardball Times chapter where he reports some novel data on batted ball types and results in different stadiums. He reports the average value, in terms of the number of runs, of three batted ball types in each stadium: outfield fly balls (OF), ground balls (GB), and line drives (LD). A value above 0.00 indicates that this batted ball type results in more runs than in a typical stadium, while a negative value indicates that this ball type results in fewer runs than average. Data on our three stadiums:
Park OF GB LDHere we see that GABP is very rough on ground balls, with each one resulting in 0.021 fewer runs than average. This was, in fact, the most negative ground ball effect among all ballparks in the article! In contrast, the average ball hit to the outfield, as well as the average line drive, results in more runs than average. Nevertheless, these two effects were far smaller than in Arlington and Coors. In fact, the following ballparks had larger positive run effects on fly balls to the outfield (OF) than GABP: Coors (rockies; 0.077), Arlington (rangers; 0.057), Wrigley (cubs; 0.045), Fenway (bosox; 0.043), U.S. Cellular (white sox; 0.040), Rogers Centre (blue jays; 0.026), and Minute Maid Park (astros; 0.019). Yes, most of these have reputations as hitters parks, but the key point here is that we're not dealing with something completely out of this world in GABP.
GABP 0.016 -0.021 0.005
Arlington 0.057 -0.004 0.017
Coors Field 0.077 0.003 0.016
Conclusion & Looking Forward
Yes, GABP is permissive when it comes to home runs. But it's not uncontrollable. The problem we're encountering has more to do with the pitchers we have on our team than anything else. As these data indicate, pitchers that induce fly balls more often than ground balls (last year = Milton) will struggle in GABP, just as they would at Wrigley, Fenway, and U.S. Cellular.
But as each of the teams at those three stadiums have shown, it is very possible to build effective pitching staffs in those ballparks. The key is to focus on pitchers that can exploit the ballpark's strengths. Great American Ballpark is, in Studenmund's words, "death to ground balls," with the most negative effect on ground ball-based runs of any park in baseball. If we build a team around pitchers who can keep the ball on the ground, we can exploit this characteristic of our park in our favor. Last year, Harang, Arroyo, Claussen, and Williams all allowed more ground balls than fly balls to the outfield (ok, Arroyo allowed equal percentages of each; source=hardball times '06 annual, pp.330-332), which gives me some hope for our rotation moving forward. -j
Impressions from 3/30/06 Spring Training Game
Tonight I got to watch my first Reds spring training game of the season. It was great to see these guys play, even if Griffey, Dunn, and Valentin all had the day off. Here are some random thoughts:
- Obviously, the biggest news from today's game was the superb and I mean superb performance of Bronson Arroyo. The most exciting thing to me about his performance to me was not so much that he didn't allow a run over 7 innings (though that was nice exciting), but that he struck out nine batters. As I mentioned in my post on the trade, his strikeout numbers fell off dramatically last year, and a big part of his performance this season will likely be determined by whether or not he can get those totals back up nearer to his '04 numbers when he averaged over 7 k/9's. To see him getting so many strikeouts was very encouraging. It's a shame that I didn't get to see his 4th inning (Selig got in my way), when he struck out the side, but even so, what I saw was very encouraging. He was hitting his spots, had good movement (as far as I can tell) on his breaking pitches, etc.
- Rick White looked solid if unspectacular. Another Weathers from what I can tell. Mike Burns wasn't quite as impressive. He was wild over his first half-inning, but induced a double play to finish it up 1-2-3. I am rooting for Ryan Wagner to win the job over Burns (I'll justify that later, though there are reasons).
- I like watching Freel hit. He's fearless; not afraid to get two strikes, and he battles pitches well from two strikes counts.. He didn't get on base today, but his approach will result (as it already has in his career) in him drawing a lot of walks from the leadoff spot. Nice to see.
- I was not as excited about Brian Buchanan. He swung at the first pitch in all three at-bats that I saw (I missed one due to the Selig press conference). This includes the first pitch he saw by knuckleballer Tim Wakefield. I'm sure he's pressing, but I'm a fan of working the count and trying to get a good pitch to hit, as well as giving yourself a chance to take a walk.
- Jacob Cruz, unfortunately, might have clinched his fate with this game. He came up three times with runners in scoring position, but went 0-4 w/ a strikeout and failed to get anyone home, even with men on 2nd and 3rd with one out in the 8th. It's hard for a team like the Reds that carries 12 pitchers to carry a pinch-hitting specialist that cannot play defense. And if that pinch hitter doesn't hit, I just don't see the Reds continuing to use him. Besides, if a lefty pinch hitter is needed, maybe we should go get Lenny Harris..?
Thursday, March 30, 2006
The NL Teams, as if they were people you knew in high school
This is brilliant. A few excerpts:
(Thanks to Baseball Think Factory for the link)
Philadelphia Phillies: This kid likes a girl, and everyone has known it for a long time. He keeps saying that he'll ask her out. Once in awhile he comes really close but he never manages to do it. So he goes back to the drawing board and trys to come up with a talent to change things, but it never works and he still likes the girl but never gets to the point of asking her out.He's not kind to the Reds though... Harsher to them than even the Devil Rays! -j
...
Pittsburgh Pirates: This girl looks pretty attractive because she's young with good potential to fill out a C cup. But she's just too young and if you hook up with her, it won't necessarily end well. Jail bait, in otherwords.
...
San Diego Padres: The overachiever. They aren't really good at anything, they just barely snuck into your one AP class and they sleep through it. But they pass it, probably with a B, because the teacher curves the grades in your class.
(Thanks to Baseball Think Factory for the link)
Juan Castro may start at SS for Twins
While not a done deal, it is apparently likely:
Thanks to Baseball Think Factory for the link. -JinAZ
Update: In other former Red news, the immortal Lenny Harris has been released by the Marlins. Shame.
The veteran defensive specialist made his second consecutive start at shortstop Tuesday against the Toronto Blue Jays. It has been rare to see the same face start at the position on consecutive days, and with less than a week until the season opener, all signs point to Castro getting the nod.Nice to see him getting a shot, as he's a solid defensive guy. And before people go scoffing at putting a player with a -2.0 projected VORP (although Davenport fielding put him at +15 at SS last year, which would make his value +13 overall) in the starting lineup, remember that Castro's projected VORP is 7 runs higher than Tony Womack's!
Thanks to Baseball Think Factory for the link. -JinAZ
Update: In other former Red news, the immortal Lenny Harris has been released by the Marlins. Shame.
Today in Baseball (3/29/06)
First of all, I'm watching the Pirates/Red Sox game on Tivo while I write this. So far, Sean Casey's hit a double, Randa's 2 for 2, and Wily Mo Pena's hit an RBI double that currently is the difference in the 1-0 game (4th inning). Good to see these guys having success; I hope they all have great seasons, as long as they're not playing the Reds.
The Red Sox/Reds ST game is on ESPN tomorrow, which means I get to see Reds baseball for the first time this spring. I'm looking forward to it...but this also means that you guys can't e-mail me and spoil the score, as I'll be watching it as a recording. :)
A few notes from my browsing today:
The Arizona Republic is reporting that Casey Daigle has developed a new pitch -- a sinker -- that is apparently reasonably effective. Casey is still fairly young (26) and did start (poorly) with Arizona in '04, so he has some big league experience. They sent him down to AA last year, and he performed well, though was primarily used as a reliever. If he doesn't make the D-backs, he might be someone worth trying to pick up in a minor league trade. I like sinkerball pitchers in GABP. (thanks to Baseball Musings for the link)
Nate Silver at Baseball Prospectus has done a set of projections based on his PECOTA data. And, like SG's projections last week, the Reds were projected to finish last. But what do they know, eh? Here are his projected standings--the "good" news, at least, is that they project the Reds to pick up 5 games on last year's 73-win season:
-J in AZ
p.s. just saw Manny Ramirez, who had a -28.9 runs/yr Gassko Range rating in left field last year (worst in baseball), making an excellent wall-slammin' catch in a spring training game. Go figure. :)
Edit: Just noticed these "headlines" from The Onion's sports page, and I can't help but link them:
A. J. Pierzynski Predicts He Will Lead League in Offensiveness
The Red Sox/Reds ST game is on ESPN tomorrow, which means I get to see Reds baseball for the first time this spring. I'm looking forward to it...but this also means that you guys can't e-mail me and spoil the score, as I'll be watching it as a recording. :)
A few notes from my browsing today:
The Arizona Republic is reporting that Casey Daigle has developed a new pitch -- a sinker -- that is apparently reasonably effective. Casey is still fairly young (26) and did start (poorly) with Arizona in '04, so he has some big league experience. They sent him down to AA last year, and he performed well, though was primarily used as a reliever. If he doesn't make the D-backs, he might be someone worth trying to pick up in a minor league trade. I like sinkerball pitchers in GABP. (thanks to Baseball Musings for the link)
Nate Silver at Baseball Prospectus has done a set of projections based on his PECOTA data. And, like SG's projections last week, the Reds were projected to finish last. But what do they know, eh? Here are his projected standings--the "good" news, at least, is that they project the Reds to pick up 5 games on last year's 73-win season:
NL Central W L RS RA BatDelta PitDeltaAlso in BP, Kevin Goldstein posted a prospect report based on this year's spring training. Here's the bit on the Reds:
Cardinals 86 76 748 703 +9 +31
Cubs 85 77 725 690 -21 +60
Brewers 84 78 742 713 +2 +26
Astros 81 81 717 716 -17 +18
Pirates 79 83 731 755 -7 -11
Reds 78 84 746 778 +9 -34
Also, I wanted to give people notice that I'll be starting up a new feature series sometime in the next few days. So stay tuned.Impressing: Homer Bailey, RHP. Bailey made just four appearances with the big league squad, but he has some observers saying that this 2004 first-round pick is better than half of the Reds rotation right now. The Reds will do the right thing here and start Bailey in the High Class A Florida State League, but getting to the big leagues before he's 21 is a distinct possibility. The over/under is currently May 3, 2007.
Disappointing: Mike Gosling, LHP. In 2001, Arizona signed Gosling to a $2 million bonus, and he began his career in 2002 by leading the Texas League in wins (14) while finishing third in ERA (3.13). Then something went wrong. He's had some minor shoulder surgery, but nothing that jumps out at you--he just hasn't been able to get people out. Arizona finally gave up on him after a pair of failed big league auditions, prompting the Reds to pick him up and hope he might earn major league spot. At least he kept the ball in the park.
-J in AZ
p.s. just saw Manny Ramirez, who had a -28.9 runs/yr Gassko Range rating in left field last year (worst in baseball), making an excellent wall-slammin' catch in a spring training game. Go figure. :)
Edit: Just noticed these "headlines" from The Onion's sports page, and I can't help but link them:
A. J. Pierzynski Predicts He Will Lead League in Offensiveness
"I think my antics in the postseason proved to my critics that I'm more than just a one-dimensional jackass," said Pierzynski, who trailed only Barry Bonds and Milton Bradley in all offensiveness categories in 2005.Steinbrenner Names Johnny Damon as New Yankee Scapegoat
According to Steinbrenner's statement, Damon exhibits all the qualities he looks for in a Yankee scapegoat, including lofty expectations, high salary, and a controversial personality that can be construed as being bad for the team's dynamics should the Yankees fall into second place.
Bergolla, Kata, and Shackelford sent down
As Marc reported, Brian Shackelford, Matt Kata, and William Bergolla were optioned to Louisville today. Kata and Bergolla are not a surprise, and frankly neither is Shackelford despite comments I've seen from fans. Here are his stats/projections:
Luck was a strange beast for Shackelford last year: in AAA he was extremely unlucky, as is evidenced by his 0.333 BABIP, which largely drove his very high ERA there (compare that to his FIP/PERA, which are both based on peripherals). With the Reds, however, he was extremely lucky. He had a 0.224 BABIP (amazingly low, almost always due to luck), and his FIP and PERA were in the mid-4 range. I think he's likely to be a bit better than his projections indicate, and he'll be at the top of the list should we need a pitcher (particularly a left hander) up in Cinci. He is starting to get up there in age (29), but the guy's only been pitching full time since '01 when he converted from a 1B (though he did both pitch and hit at the University of Oklahoma). I'm sure we'll see him again this year.
-j
| Year/Team | IP | K/9 | BB/9 | HR/9 | BABIP | ERA | FIP | PERA | VORP | GB% |
| 2003/A+ | 27.3 | 6.6 | 2.6 | 0.33 | 0.205 | 1.98 | 3.09 | 5.47 | 4.4 | --- |
| 2003/AA | 20.0 | 8.6 | 6.3 | 1.35 | 0.359 | 6.30 | 5.35 | 9.00 | -8.2 | --- |
| 2003/AAA | 15.7 | 5.7 | 4.0 | 0.00 | 0.288 | 2.29 | 3.26 | 4.20 | 3.3 | --- |
| 2004/AAA | 73.0 | 7.8 | 5.2 | 0.74 | 0.263 | 3.58 | 4.27 | 5.35 | 10.0 | -- |
| 2005/AAA | 32.7 | 5.8 | 2.8 | 0.28 | 0.333 | 5.23 | 3.23 | 4.18 | 0.1 | 57% |
| 2005/CIN | 29.7 | 5.2 | 2.7 | 0.61 | 0.224 | 2.43 | 4.45 | 4.40 | 9.1 | 45% |
| PECOTA75 | 42.0 | 5.6 | 4.1 | 1.07 | 0.283 | 4.16 | 4.87 | 4.79 | 4.8 | 47% |
| PECOTA | 36.0 | 5.5 | 4.3 | 1.25 | 0.299 | 5.06 | 5.20 | 5.55 | 0.5 | 48% |
| PECOTA25 | 32.3 | 5.3 | 4.5 | 1.67 | 0.324 | 6.64 | 5.92 | 6.94 | -5.9 | 49% |
| ZIPS | 62.0 | 6.4 | 4.6 | 0.87 | 0.283 | 4.94 | 4.59 | --- | --- | --- |
Luck was a strange beast for Shackelford last year: in AAA he was extremely unlucky, as is evidenced by his 0.333 BABIP, which largely drove his very high ERA there (compare that to his FIP/PERA, which are both based on peripherals). With the Reds, however, he was extremely lucky. He had a 0.224 BABIP (amazingly low, almost always due to luck), and his FIP and PERA were in the mid-4 range. I think he's likely to be a bit better than his projections indicate, and he'll be at the top of the list should we need a pitcher (particularly a left hander) up in Cinci. He is starting to get up there in age (29), but the guy's only been pitching full time since '01 when he converted from a 1B (though he did both pitch and hit at the University of Oklahoma). I'm sure we'll see him again this year.
-j
Wednesday, March 29, 2006
Reds pick up Ryan Jorgensen
Thanks to the keen eye of Brain B, we've learned that the Reds have acquired catcher Ryan Jorgensen, 27, for infielder Carlos Piste from the Florida Marlins.
This just looks like a move to improve the catching depth of the organization. I'll agree with JD that it seems unlikely that he'll show up in the big leagues any time soon. I'd guess that both Ross and Sardinha are in front of him on the depth chart. Perez might be as well.. But as has become my custom, here are some stats:
No idea about his defense.
As for Piste, I can't find a record of him since '3, when he was a young rookie-ball infielder with the Baltimore organization. He signed as an undrafted free agent in '01.
-j
This just looks like a move to improve the catching depth of the organization. I'll agree with JD that it seems unlikely that he'll show up in the big leagues any time soon. I'd guess that both Ross and Sardinha are in front of him on the depth chart. Perez might be as well.. But as has become my custom, here are some stats:
| Year/Team | AB | K/BB | SB/% | OBP | SLG | OPS | GPA |
| 2003/AA | 211 | 1.77 | 1/100% | 0.337 | 0.403 | 0.740 | 0.252 |
| 2004/AAA | 201 | 5.67 | 0/0% | 0.289 | 0.433 | 0.722 | 0.238 |
| 2005/AAA | 137 | 2.19 | 1/100% | 0.308 | 0.277 | 0.585 | 0.208 |
| 2005/FLO | 4 | 0/3 | 0/0% | 0.000 | 0.000 | 0.000 | 0.000 |
No idea about his defense.
As for Piste, I can't find a record of him since '3, when he was a young rookie-ball infielder with the Baltimore organization. He signed as an undrafted free agent in '01.
-j
Tuesday, March 28, 2006
Ohio vs. Missouri
I swear I'm not going to make this a Baseball Prospectus summary blog, but it's a slow news day and Jim Baker had a fun article. Excerpt:
Ohio vs. Missouri-j in azOf course, that's nothing like the vitriol between these two states. The things they say about one another are far too strong for this, America's most family-friendly Web site. In this proposition, the battle is between the baseball teams of these respective states: the Royals and Cardinals representing Missouri and the Indians and Reds stepping up for Ohio. While not quite reverse mirror images of one another, each state currently boasts one team that is up and one that is down. Combined, they meet somewhere near the middle. Last year, these were the results:
Ohio: 166-158, 1,610 RS 1,532 RAIt would appear that Ohio has an excellent chance at repeating in that Missouri is dependent on the Royals getting out of the 100-loss ghetto because the Cardinals are bound to slip by a few games, even in the process of romping to another divisional title. Meanwhile, the bookmakers are setting Cincinnati's over/under right about where last year's record concluded: 73 wins. A slight step backwards is anticipated for Cleveland, which would still give Ohio the upper hand.
Missouri: 156-168, 1,504 RS 1,569 RA
Today in Baseball Prospectus...
As frustrating as I sometimes find their stats (too much proprietary info...even for their subscribers!), the Baseball Prospectus folks do put out some great material. Today, there were several articles that were of particular interest to Reds fans--I'll summarize two of them since I'm sure many people don't have subscriptions.
1. Kevin Goldstein wrote a fascinating essay on the draft practices of different big-league clubs. He created a ranking of ballclubs based on the money paid to their top-5 draft picks over the past three years multiplied by risk coefficients for each player. Risk coefficients were set based on the riskiness of each acquisition (presumably this was based on some data), with college hitters being the least risky and high school hitters being the most risky (I always thought high school pitchers were harder to project/keep injury free...??).
He then plotted this score vs. the total dollars spent on draft picks and came up with four types of clubs: high risk-high spenders, low-risk-high spenders, high risk-low spenders, and low-risk low-spenders. Interestingly, the only type of organization that didn't have examples of highly successful programs were the low-risk, low-spending teams like the Phillies or the Blue Jays. The Athletics, Diamondbacks, and Indians typified the low-risk, high spending teams, while the Twins and Devil Rays were high risk, high spending teams. The Reds fit into the high risk, low spending bracket, along actual productive systems like the Braves and the Cardinals.
2. Joe Sheehan has a piece on the recently released Carlos Pena, who many Reds fans have been clamoring for Krivsky to sign and stick in our hole at first base this year. It's not a complementary article, and highlights his high strikeout rate as a major factor that has impaired his development. Here's an excerpt:
Of course, Sheehan closes his article with this:
-j
1. Kevin Goldstein wrote a fascinating essay on the draft practices of different big-league clubs. He created a ranking of ballclubs based on the money paid to their top-5 draft picks over the past three years multiplied by risk coefficients for each player. Risk coefficients were set based on the riskiness of each acquisition (presumably this was based on some data), with college hitters being the least risky and high school hitters being the most risky (I always thought high school pitchers were harder to project/keep injury free...??).
He then plotted this score vs. the total dollars spent on draft picks and came up with four types of clubs: high risk-high spenders, low-risk-high spenders, high risk-low spenders, and low-risk low-spenders. Interestingly, the only type of organization that didn't have examples of highly successful programs were the low-risk, low-spending teams like the Phillies or the Blue Jays. The Athletics, Diamondbacks, and Indians typified the low-risk, high spending teams, while the Twins and Devil Rays were high risk, high spending teams. The Reds fit into the high risk, low spending bracket, along actual productive systems like the Braves and the Cardinals.
2. Joe Sheehan has a piece on the recently released Carlos Pena, who many Reds fans have been clamoring for Krivsky to sign and stick in our hole at first base this year. It's not a complementary article, and highlights his high strikeout rate as a major factor that has impaired his development. Here's an excerpt:
Pena simply hasn’t been a very good major leaguer. He has a career line of .243/.330/.459 in 1887 plate appearances across five seasons. His inability to make contact--492 strikeouts in 1652 at-bats, one every 3.4 ABs--and the middling power he generates when he does hit the ball have prevented him from putting up the kind of numbers you need from a first baseman. He’s been remarkably consistent at a level just a bit below what you need to get from a first sacker: EQAs ranging from .270 to .286 in his four full seasons. His defense, at least according to Clay Davenport’s system, has been underwhelming, below average in every season.His ultimate point is that we should perhaps pay more attention to strikeout rates when we evaluate players, but the article also argues that any move the Reds might make with Pena should be done cautiously.
Of course, Sheehan closes his article with this:
I still think Pena can have a career. He’s 28 years old and coming off of two season of .280+ EQAs, and he did close last year with a strong second half. In fact, having written this column, I expect he’ll latch on with the Astros or something and hit .295/.380/.540 with 37 home runs, winning Comeback Player of the Year honors. And a Nobel Prize. And a People’s Choice Award.So maybe we should go grab him. :)
-j
Monday, March 27, 2006
Reds sign Terrance Long
The Reds signed Terrance Long to a minor league deal today. Long, 30, probably should be considered a candidate in the fight for the reserve OF position that previously seemed a competition between Quintin McCracken and Dewayne Wise. With Wise's injury, McCracken being injured for much of camp, Tuffy Rhodes' release, and Denorfia's promotion, it should be fairly easy for Long, a starter last year for the Royals, to get into the mix.
Some Stats:
Offensively, there's not much here; a contact guy with modest (at best) power, no speed, and what little OBP he has is BA-heavy. He still hit better than McCracken last year, however. Defensively, he showed little value, and according to Baseball Prospectus was actually nicknamed "Magellan" in Oakland due to his poor routes to balls:
All in all, he's a replacement player. The Reds have him signed to a minor league contract, which means he may or not play this year for the Reds. -j
Some Stats:
| Year/Team | PA | K/BB | SB/% | OBP | SLG | OPS | GPA | EqA | VORP | GB/LD/OF |
| 2003/OAK | 522 | 2.16 | 4/80% | 0.293 | 0.385 | 0.678 | 0.2281 | 0.238 | -10.1 | --- |
| 2004/SDN | 313 | 2.68 | 3/60% | 0.335 | 0.420 | 0.755 | 0.25575 | 0.265 | 7.4 | --- |
| 2005/KCA | 489 | 1.87 | 3/50% | 0.321 | 0.387 | 0.708 | 0.2412 | 0.253 | 0.0 | 39/21/18 |
| 06PECOTA | 387 | 2.04 | 2/50% | 0.319 | 0.396 | 0.715 | 0.24255 | 0.285 | 1.8 |
Offensively, there's not much here; a contact guy with modest (at best) power, no speed, and what little OBP he has is BA-heavy. He still hit better than McCracken last year, however. Defensively, he showed little value, and according to Baseball Prospectus was actually nicknamed "Magellan" in Oakland due to his poor routes to balls:
| Year/Team | Davenport | Dial | Gassko | Walsh Arm |
| 2003/OAK | LF: 2 (64) RF: 6 (63) | --- | --- | |
| 2004/SDN | LF: 0 (37) RF: 0 (22) | --- | --- | |
| 2005/KCA | LF: -9 (91) RF: -1 (15) | LF: -4.9 | LF: -8.5 | LF: 0.2 |
All in all, he's a replacement player. The Reds have him signed to a minor league contract, which means he may or not play this year for the Reds. -j
Quantifying Fan Interest, pt. 3
Previously, I described my initial efforts to develop a model that predicts the attendance rates of major league baseball teams, which I could then use to examine which teams have the "best" fans (i.e. fans that show up at a greater rate than expected) and which teams have the "worst" fans (i.e. fans that show up at a lower rate than expected). The previous models were very simple: I used city population data as well as win totals to predict the attendance rates of the 2005 season.
I've been fiddling with this model further over the past few weeks and have developed a new model that explains attendance rates from 1999 through 2005. As you can imagine, a model explaining attendance fluctuations across multiple years must be more complicated in order to be effective. To enhance the model's explanatory power, I have added additional or modified predictors to this analysis. While I mentioned some of these new variables at the end of part 2, others were suggested by IslandRed over at RedsZone.com in a response to my original model. He cited a chapter (which, unfortunately, I still haven't managed to track down) in Baseball Between the Numbers by Baseball Prospectus, which modelled team revenue according to a number of different variables. I've adopted several of these parameters in my new model.
I started with a fresh set of data from the Lahman Teams database. This wonderful, free database contains an absurd number of (mostly traditional) annual statistics on teams and players going back into the 1800's. Any other wannabe analysts like myself are strongly encouraged to check it out for any work you might want to do. I also included data from several other sources. To start, I will first walk through the various predictors that I considered:
One of the things I most wanted to do this time around was to generalize this work and try to model more than just '05 attendance rates. In order to use all major league teams, I started with the 1999 season and used data through the '05 season. I skipped the inaugural season for the Diamondbacks and the Devil Rays (1998) because those teams were sure to behave oddly that year…and because I wanted to use Wins(y-1) (see below) . To test whether substantial differences existed among the years, I included Years as a variable in the model.
The U.S. Census data were collected in 1990 and 2000, while the Canadian Census was taken in 1996 and 2001. To account for shifts in city populations between these times, I used the observed rate of change between each census date and changed city populations by that rate each year. For example, Phoenix, my current home town, is growing at an absurd rate. In 1990, the Phoenix MSA population was 2,238,480, but changed by a rate of 101,340 individuals per year to reach 3,251,876 by 2000 (in contrast, Cincinnati's MSA grew by only 161,631 over the entire 10-year period). To estimate the '99 and 2001-2005 Phoenix populations, I assumed this rate of change was constant (I realize it is more likely exponential, but this is was good enough for me) and moved the Phoenix population by 101,340 individuals per year. This resulted in an '05 Phoenix MSA population estimate of 3,758,574.
Finally, using metropolitan areas results in more shared markets than in my previous models: the Orioles and Nationals as well as Giants and A's now share markets, in addition to the Angels & Dodgers, Cubs & White Sox, and Mets & Yankees. This meant that I once again had to wrestle with how to handle such a situation. While from one perspective it does seem intuitive to split these markets by some fraction between the two teams, it also may be the case that having two teams in a market may not result in a purely negative effect on the respective team attendance. Two-team markets may increase overall interest in baseball in that area, which could result in increased attendance for each team. Furthermore, it's also the case that fans of one team might not be potential fans of the other (I think of some Mets fans I've known--anti-Yankee NY baseball fans--as examples of this). Some combination of all of these things must be happening, but it's hard to know how to account for this. Therefore, I considered two approaches: leaving the MSA populations as they are (MSApop), and splitting the populations evenly between the two teams (splitMSApop). I'll revisit this below in the results.
As before, it was necessary to log10-transform these data to linearize the relationship between population and attendance.
Simply including the time since each ballpark was built didn't seem to work, as many old parks--Wrigley, Fenway, Dodgers Stadium, etc--are still fine places to watch a game. Instead, I sought out a mechanism of rating each ballpark. My solution was to use Brian Merzback's Ballpark Review ratings. While it's not as ideal as I'd like, Brian has visited all but one existing major league park, as well as many of the ones that were phased out over this past decade. His reviews seem reasonable and well justified, and I'm pretty much in agreement with him on the 7 or so MLB parks that I've attended. I converted his letter grade +/- system into a 1-13 ranking, with 1 being best and 13 being worst. I had to supplement his ratings with those for the five stadiums that he did not report grades as follows: Bank One Ballpark (B+ based on personal experience, comparing it to GAB and PNC park), the Astrodome (C; might be generous?), Qualcomm Stadium (C; a wild guess), Kingdome (D; based on negative reports I've seen), and Candlestick park (C; based on climate more than anything).
After considering all available models (details on how this done are happily given via e-mail or in the comments…didn't want to fuss up this post with those details, as this post is long enough already!), I selected this model moving forward (variables roughly ordered by importance):
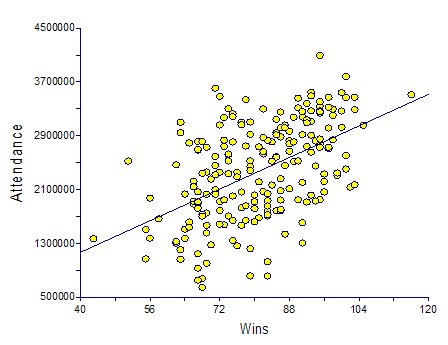
Attendance = -117,887*Stadium + 16,297*Wins(y-1) + 13,331*Wins + 513,777*Honeymoon + 496,434*log(splitMSApop) + -2,736,589
This model explains ~61% of variation in attendance rates (adjusted Rsquared=0.5961) from '99-'05. All variables were highly significant (P less than 0.003 for all variables), there were no significant outliers, and there were no signs of heterogeneous variance or deviations from normality. Let's walk through each of these variables:
Stadium: The coefficient on Stadium indicates that for each increment along Merzback's ballpark rating scale, teams gain roughly 120,000 in attendance each year. To put this in perspective, the model predicts that the Metrodome, which got a D-, would pull 1,414,644 fewer fans each year than Wrigley Field, which got an A+. If we assume ~$25 per fan that comes through the gate, that's a difference upwards of $35 million a year! That's a staggering difference. While these numbers are highly contingent on the reliability of Merzback's ratings, this was perhaps the most important factor in the model. Ballpark quality clearly does have a tremendous influence on the revenue a ballclub can gather from attendance.

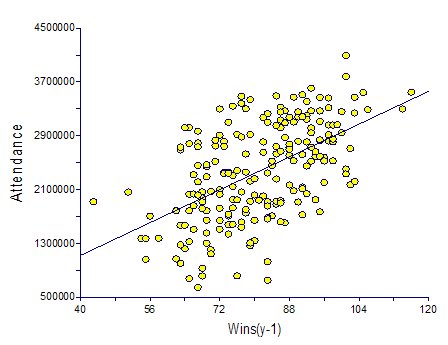
Wins and Wins(y-1): In both the Baseball Prospectus chapter, as well as my previous article, wins from the previous season seem to be more important that wins in the current season for determining attendance. A win in the current season should increase attendance by 13,000 people, but should also increase attendance by 16,000 in the following season. Let's look at how this should affect influence attendance for the Reds vs. the Cardinals. The Reds won 76 games in '04 and 73 games in '05, whereas the Cardinals won 105 games in '04 and 100 games in '05. Therefore, the Reds would be expected to have drawn (105-76)*16,297 + (100-73)*13,331 = 472,613 + 359,937 = 832,550 fewer fans last year than the Cardinals. At ~$25/fan, that's a difference of roughly $20 million last year. Again, a staggering difference.


Honeymoon: In the year that a team opens in a new stadium, clubs can be expected to draw roughly 500,000 more fans than usual. While this effect does not seem to disappear entirely by the second year, it's dramatically weaker in subsequent years.
MSA Population: In terms of the explanatory power of the model, there was virtually no difference between using the straight MSA-Population values vs. the split MSA Population values, which divided MSA Populations in half for teams in two-market cities. The R-square for the straight model was 0.6051, while the R-square for the split-model was 0.6057 (all other variables were held constant). Furthermore, the coefficient estimates were very similar for both models. Finally, the residuals showed very few differences in terms of the relative rankings of the different teams. The biggest effect I saw was that the White Sox and A's, which had the worst fans (based on residuals) in both models, were further from the pack with the straight MSApop data. The splitMSApop data made for a more uniform distribution. Therefore, I decided to use the splitMSApop data. In all honesty, it doesn't seem to make that much difference.

To look at the variables that weren't selected:
Year: Adding year to the model above resulted in a slight drop in the fit of the model (adjusted R2=0.5942), and it was not at all significant (t=-0.26, P=0.796). A graph revealed almost no visible change in attendance over the years considered in this study.
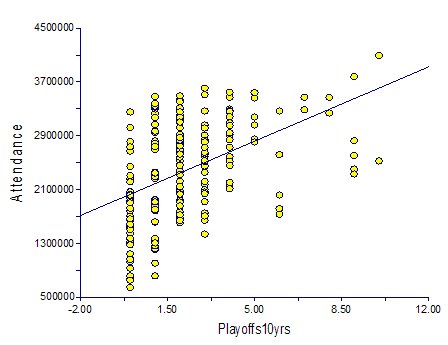
Playoffs:Adding playoffs to the model did make for a very slight improvement in the fit of the model (adjusted R2 = 0.6004). However, the effect was not significant (t=1.79, P=0.0743). It's admittedly a bit borderline, but given the strength of the other effects, I decided not to include it. It's primary effect, looking at the residuals, was to penalize teams like the Yankees and the Braves in the team residual rankings. This might be appropriate, but I would prefer to keep as many degrees of freedom as I can in the model so that the coefficient estimates are as powerful as possible. It is fairly well correlated with the win variables, and therefore the pattern you see in the graph below is at least represented by the win total data.
 Relative Team Attendance
My whole motivation in trying to build a model of team attendance was to take a look at the residuals. The residuals are the differences, in terms of the number of fans, between the actual team attendance and the team attendance predicted by the model. Teams with outstanding fans should come to the ballpark at a higher rate than predicted by this model, while teams with the worst fans should come to the ballpark at a lower rate than predicted by this model. Here is the list of teams and their average residual (mean across 7 years) from this model. The scatterplot on the right reflects the data on the left, with random scatter along the x-axis to make the team names legible):
As in my earlier attempts, St. Louis fans were the best, with an average of 596,368 fans above what the model would predict. However, the gap has closed considerably. Baltimore, even after accounting for the gorgeous Camden Yards, drew at the second highest relative rate, with Padres, Rockies, and Dodger fans also showing up at well above predicted rates. The Athletics, White Sox, and Marlins came up the worst, drawing more than 600,000 fewer fans each year than the model would have predicted.
The Reds came in just above average, drawing roughly 100,000 more fans, on average, than predicted. Here are the individual years and their respective residuals:
 The Reds' best year attendance-wise during that period was 2000, the year following the exciting 1999 season that came one win against the Mets away from entering the playoffs. The model predicted an increase in attendance that year of ~200,000 fans relative to '99, but Reds fans showed up in droves--400,000 more fans than expected!, resulting in the best total attendance during the 7-year period (2,577,371). This was, in fact, more than 200,000 more fans than showed up in '03 for the opening of Great American Ballpark (2,355,259). This relatively poor turnout resulted in the worst Reds residual showing up in 2003, 270,000+ fans fewer than expected in an inaugural season. The moral of the story? Reds fans like winners more than shiny ballparks. Castellini should take note!
1. The most obvious problem to a statistics-oriented person is that I've violated assumptions of independence. I treated each year of each team as an independent data point, and clearly that is not an appropriate assumption. The appropriate mechanism for dealing with this is to include the team as a factor in the model. This process assigns a binary variable to all but one team, the last team being identified when all those variables read "0." The problem with doing this, and the reason I did not do it, is that these binary variables capture the differences unique to each team. It was precisely these differences that I wanted to quantify as a measure of fan interest. I could look at coefficients in front of each binary variable, but I would not get to see the coefficient for whichever team did not have a binary variable. Furthermore, these team variables would confound with my measures of metropolitan population and stadium quality, which were relatively constant within each city. … So it made sense to me to do it the way I did.
But I'm sure all of my former stats teachers are groaning right now. In an attempt to placate them, I did go ahead and run the model "correctly" to see how much of an effect my assumption violation had on the coefficients of the model. Here they are:
As you can see, there was an effect, particularly for splitMSApop and stadium quality, but this is not surprising. Each team tends to have a fairly steady city population (except Montreal/Washington), and most teams did not switch ballparks from '99-'05. Therefore, including a variable for team pulled some of the variance away from these variables and thus changed the coefficient estimates.
Fortunately, the other three variables--win, win(y-1), and honeymoon--were relatively unaffected. Therefore, I feel good about my decision to use the model I did. I'm sure some people may disagree, but this is just for fun anyway. :)
2. I used relative attendance as my measure of fan interest. While this usually works fine, it can become a problem in a few circumstances. This was particularly notable for the Boston Red Sox. I think most people would expect their fans to be at least as supportive of their team as those of the Yankees, if not more so. However, Fenway Park has the smallest capacity of any major league park at 33,871, which puts their maximum annual attendance (assuming 81 games) at 2,743,551. The Red Sox have pulled just about this number each year in this study, and yet they are pegged as pulling roughly 500,000 fewer fans than expected by the model. I'm certain that if their ballpark had a higher capacity, they'd perform much better in this analysis.
A solution to this would be to look at total revenue for the teams, rather than just attendance. I have yet to come up with these data, although I hear that Forbes magazine publishes annual financial reports on MLB teams. In future work, I may take those figures and use them in lieu of attendance to see how things change.
For now, however, I'm going to leave this where it is. This has been a fun exercise, but I've taken it as far as I really care to for now. If folks are interested in fiddling more with the numbers, here is my excel spreadsheet (most stats were done in SAS or NCSS). All I ask is that you provide credit should you use it in your own projects. Thanks, JinAZ
I've been fiddling with this model further over the past few weeks and have developed a new model that explains attendance rates from 1999 through 2005. As you can imagine, a model explaining attendance fluctuations across multiple years must be more complicated in order to be effective. To enhance the model's explanatory power, I have added additional or modified predictors to this analysis. While I mentioned some of these new variables at the end of part 2, others were suggested by IslandRed over at RedsZone.com in a response to my original model. He cited a chapter (which, unfortunately, I still haven't managed to track down) in Baseball Between the Numbers by Baseball Prospectus, which modelled team revenue according to a number of different variables. I've adopted several of these parameters in my new model.
I started with a fresh set of data from the Lahman Teams database. This wonderful, free database contains an absurd number of (mostly traditional) annual statistics on teams and players going back into the 1800's. Any other wannabe analysts like myself are strongly encouraged to check it out for any work you might want to do. I also included data from several other sources. To start, I will first walk through the various predictors that I considered:
Variables
Years 1999 through 2005 (Years)One of the things I most wanted to do this time around was to generalize this work and try to model more than just '05 attendance rates. In order to use all major league teams, I started with the 1999 season and used data through the '05 season. I skipped the inaugural season for the Diamondbacks and the Devil Rays (1998) because those teams were sure to behave oddly that year…and because I wanted to use Wins(y-1) (see below) . To test whether substantial differences existed among the years, I included Years as a variable in the model.
Metropolitan Populations (MSApop and splitMSApop)
In a departure from my previous work, the new model uses Metropolitan Areas reported by the U.S. and Canadian censuses. The advantage of this is that they allow one to account for cities that have considerable suburb populations. For example, Atlanta's city population in '03 was 423,019, which was 23rd among MLB cities. In contrast, using census data, Atlanta's metropolitan area was 4,112,198, 11th among MLB population areas. These new data result in a big improvement in what the models predict about Atlanta's attendance, as well as other cities. Whereas the city population data explained 34% of variation in 2005 attendance, the MSA data explained 47%.The U.S. Census data were collected in 1990 and 2000, while the Canadian Census was taken in 1996 and 2001. To account for shifts in city populations between these times, I used the observed rate of change between each census date and changed city populations by that rate each year. For example, Phoenix, my current home town, is growing at an absurd rate. In 1990, the Phoenix MSA population was 2,238,480, but changed by a rate of 101,340 individuals per year to reach 3,251,876 by 2000 (in contrast, Cincinnati's MSA grew by only 161,631 over the entire 10-year period). To estimate the '99 and 2001-2005 Phoenix populations, I assumed this rate of change was constant (I realize it is more likely exponential, but this is was good enough for me) and moved the Phoenix population by 101,340 individuals per year. This resulted in an '05 Phoenix MSA population estimate of 3,758,574.
Finally, using metropolitan areas results in more shared markets than in my previous models: the Orioles and Nationals as well as Giants and A's now share markets, in addition to the Angels & Dodgers, Cubs & White Sox, and Mets & Yankees. This meant that I once again had to wrestle with how to handle such a situation. While from one perspective it does seem intuitive to split these markets by some fraction between the two teams, it also may be the case that having two teams in a market may not result in a purely negative effect on the respective team attendance. Two-team markets may increase overall interest in baseball in that area, which could result in increased attendance for each team. Furthermore, it's also the case that fans of one team might not be potential fans of the other (I think of some Mets fans I've known--anti-Yankee NY baseball fans--as examples of this). Some combination of all of these things must be happening, but it's hard to know how to account for this. Therefore, I considered two approaches: leaving the MSA populations as they are (MSApop), and splitting the populations evenly between the two teams (splitMSApop). I'll revisit this below in the results.
As before, it was necessary to log10-transform these data to linearize the relationship between population and attendance.
Team Wins in Current Year (Wins)
In a straightforward fashion, I included team wins in the current year as a potential predictor of team attendance.Team Wins in the Previous Year (Wins(y-1))
My previous model, as well as the work by Baseball Prospectus, found that previous year win totals were even more important predictors of team attendance than current year totals. I opted to only consider the previous year's wins. While I could have considered previous years' totals, my previous model found that previous-year totals were just as good as '02 through '05 win totals. Furthermore, using '99-'05 data only gave me 7 seasons worth of data. Increasing the number of previous season win totals I used would have required me to either drop Arizona and Tampa Bay from my dataset or scale back the total number of seasons in my model. I didn't want to do either. Finally, there was another variable available to account for past historical success (or lack thereof):Playoff Appearances in the Past 10 years (Playoffs)
Here I simply summed, for each year, the number of playoff appearances--by winning the division or wildcard--that had occurred in the previous 10 seasons.Quality of Stadium (Stadium)
Some teams, like the Minnesota Twins or the New York Mets, have rather lousy stadiums. By comparison, 16 ballclubs have built new parks since the White Sox opened the second Comisky Park in 1991. These new parks, which are almost all gorgeous places to watch a ballgame, have resulted in far more enjoyable experiences for fans. MLB clubs claim they increase attendance over the long term. Therefore, I wanted to try to account for this in the model.Simply including the time since each ballpark was built didn't seem to work, as many old parks--Wrigley, Fenway, Dodgers Stadium, etc--are still fine places to watch a game. Instead, I sought out a mechanism of rating each ballpark. My solution was to use Brian Merzback's Ballpark Review ratings. While it's not as ideal as I'd like, Brian has visited all but one existing major league park, as well as many of the ones that were phased out over this past decade. His reviews seem reasonable and well justified, and I'm pretty much in agreement with him on the 7 or so MLB parks that I've attended. I converted his letter grade +/- system into a 1-13 ranking, with 1 being best and 13 being worst. I had to supplement his ratings with those for the five stadiums that he did not report grades as follows: Bank One Ballpark (B+ based on personal experience, comparing it to GAB and PNC park), the Astrodome (C; might be generous?), Qualcomm Stadium (C; a wild guess), Kingdome (D; based on negative reports I've seen), and Candlestick park (C; based on climate more than anything).
The effect of a new stadium (Honeymoon)
During some initial runs of this model, I found that the most common positive outliers were for teams in the year they open a new ballpark. To account for this, I included a binary variable, Honeymoon, for the first year after a team opens a new park. While this positive effect may remain for years after a new park opens, this simple variable eliminated all of my severe outliers.Model Selection
If you're keeping score, that is 8 total variables that I am using to explain 7 years of attendance ratings. Several of these variables are sure to be correlated with one another (especially MSAPop and splitMSApop), and one should always be mindful of overloading a model with variables and artificially increasing your R^2. Therefore, I employed used an all-possible subset selection approach to choose the best available model.After considering all available models (details on how this done are happily given via e-mail or in the comments…didn't want to fuss up this post with those details, as this post is long enough already!), I selected this model moving forward (variables roughly ordered by importance):
Attendance = -117,887*Stadium + 16,297*Wins(y-1) + 13,331*Wins + 513,777*Honeymoon + 496,434*log(splitMSApop) + -2,736,589
This model explains ~61% of variation in attendance rates (adjusted Rsquared=0.5961) from '99-'05. All variables were highly significant (P less than 0.003 for all variables), there were no significant outliers, and there were no signs of heterogeneous variance or deviations from normality. Let's walk through each of these variables:
Stadium: The coefficient on Stadium indicates that for each increment along Merzback's ballpark rating scale, teams gain roughly 120,000 in attendance each year. To put this in perspective, the model predicts that the Metrodome, which got a D-, would pull 1,414,644 fewer fans each year than Wrigley Field, which got an A+. If we assume ~$25 per fan that comes through the gate, that's a difference upwards of $35 million a year! That's a staggering difference. While these numbers are highly contingent on the reliability of Merzback's ratings, this was perhaps the most important factor in the model. Ballpark quality clearly does have a tremendous influence on the revenue a ballclub can gather from attendance.

Wins and Wins(y-1): In both the Baseball Prospectus chapter, as well as my previous article, wins from the previous season seem to be more important that wins in the current season for determining attendance. A win in the current season should increase attendance by 13,000 people, but should also increase attendance by 16,000 in the following season. Let's look at how this should affect influence attendance for the Reds vs. the Cardinals. The Reds won 76 games in '04 and 73 games in '05, whereas the Cardinals won 105 games in '04 and 100 games in '05. Therefore, the Reds would be expected to have drawn (105-76)*16,297 + (100-73)*13,331 = 472,613 + 359,937 = 832,550 fewer fans last year than the Cardinals. At ~$25/fan, that's a difference of roughly $20 million last year. Again, a staggering difference.
Honeymoon: In the year that a team opens in a new stadium, clubs can be expected to draw roughly 500,000 more fans than usual. While this effect does not seem to disappear entirely by the second year, it's dramatically weaker in subsequent years.
MSA Population: In terms of the explanatory power of the model, there was virtually no difference between using the straight MSA-Population values vs. the split MSA Population values, which divided MSA Populations in half for teams in two-market cities. The R-square for the straight model was 0.6051, while the R-square for the split-model was 0.6057 (all other variables were held constant). Furthermore, the coefficient estimates were very similar for both models. Finally, the residuals showed very few differences in terms of the relative rankings of the different teams. The biggest effect I saw was that the White Sox and A's, which had the worst fans (based on residuals) in both models, were further from the pack with the straight MSApop data. The splitMSApop data made for a more uniform distribution. Therefore, I decided to use the splitMSApop data. In all honesty, it doesn't seem to make that much difference.

To look at the variables that weren't selected:
Year: Adding year to the model above resulted in a slight drop in the fit of the model (adjusted R2=0.5942), and it was not at all significant (t=-0.26, P=0.796). A graph revealed almost no visible change in attendance over the years considered in this study.
Playoffs:Adding playoffs to the model did make for a very slight improvement in the fit of the model (adjusted R2 = 0.6004). However, the effect was not significant (t=1.79, P=0.0743). It's admittedly a bit borderline, but given the strength of the other effects, I decided not to include it. It's primary effect, looking at the residuals, was to penalize teams like the Yankees and the Braves in the team residual rankings. This might be appropriate, but I would prefer to keep as many degrees of freedom as I can in the model so that the coefficient estimates are as powerful as possible. It is fairly well correlated with the win variables, and therefore the pattern you see in the graph below is at least represented by the win total data.
 Relative Team Attendance
My whole motivation in trying to build a model of team attendance was to take a look at the residuals. The residuals are the differences, in terms of the number of fans, between the actual team attendance and the team attendance predicted by the model. Teams with outstanding fans should come to the ballpark at a higher rate than predicted by this model, while teams with the worst fans should come to the ballpark at a lower rate than predicted by this model. Here is the list of teams and their average residual (mean across 7 years) from this model. The scatterplot on the right reflects the data on the left, with random scatter along the x-axis to make the team names legible):
| 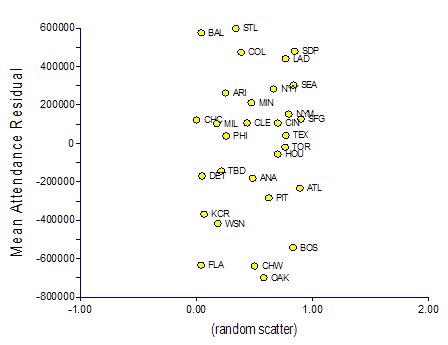 |
As in my earlier attempts, St. Louis fans were the best, with an average of 596,368 fans above what the model would predict. However, the gap has closed considerably. Baltimore, even after accounting for the gorgeous Camden Yards, drew at the second highest relative rate, with Padres, Rockies, and Dodger fans also showing up at well above predicted rates. The Athletics, White Sox, and Marlins came up the worst, drawing more than 600,000 fewer fans each year than the model would have predicted.
The Reds came in just above average, drawing roughly 100,000 more fans, on average, than predicted. Here are the individual years and their respective residuals:
 The Reds' best year attendance-wise during that period was 2000, the year following the exciting 1999 season that came one win against the Mets away from entering the playoffs. The model predicted an increase in attendance that year of ~200,000 fans relative to '99, but Reds fans showed up in droves--400,000 more fans than expected!, resulting in the best total attendance during the 7-year period (2,577,371). This was, in fact, more than 200,000 more fans than showed up in '03 for the opening of Great American Ballpark (2,355,259). This relatively poor turnout resulted in the worst Reds residual showing up in 2003, 270,000+ fans fewer than expected in an inaugural season. The moral of the story? Reds fans like winners more than shiny ballparks. Castellini should take note!
Critiques
While I do feel that this work is sound, there are some clear critiques one might offer against it. Here are two, along with some justifications for them:1. The most obvious problem to a statistics-oriented person is that I've violated assumptions of independence. I treated each year of each team as an independent data point, and clearly that is not an appropriate assumption. The appropriate mechanism for dealing with this is to include the team as a factor in the model. This process assigns a binary variable to all but one team, the last team being identified when all those variables read "0." The problem with doing this, and the reason I did not do it, is that these binary variables capture the differences unique to each team. It was precisely these differences that I wanted to quantify as a measure of fan interest. I could look at coefficients in front of each binary variable, but I would not get to see the coefficient for whichever team did not have a binary variable. Furthermore, these team variables would confound with my measures of metropolitan population and stadium quality, which were relatively constant within each city. … So it made sense to me to do it the way I did.
But I'm sure all of my former stats teachers are groaning right now. In an attempt to placate them, I did go ahead and run the model "correctly" to see how much of an effect my assumption violation had on the coefficients of the model. Here they are:
| Variable | Coefficent from my "bad" model | Coefficient from the "right" model |
| Intercept | -2,736,589 | -164,622,313 |
| log(splitMSApop) | 496,434 | 2,414,243 |
| win(y-1) | 16,297 | 14,811 |
| win | 13,331 | 13,552 |
| stadium | -117,887 | -46,473 |
| honeymoon | 513,777 | 539,525 |
As you can see, there was an effect, particularly for splitMSApop and stadium quality, but this is not surprising. Each team tends to have a fairly steady city population (except Montreal/Washington), and most teams did not switch ballparks from '99-'05. Therefore, including a variable for team pulled some of the variance away from these variables and thus changed the coefficient estimates.
Fortunately, the other three variables--win, win(y-1), and honeymoon--were relatively unaffected. Therefore, I feel good about my decision to use the model I did. I'm sure some people may disagree, but this is just for fun anyway. :)
2. I used relative attendance as my measure of fan interest. While this usually works fine, it can become a problem in a few circumstances. This was particularly notable for the Boston Red Sox. I think most people would expect their fans to be at least as supportive of their team as those of the Yankees, if not more so. However, Fenway Park has the smallest capacity of any major league park at 33,871, which puts their maximum annual attendance (assuming 81 games) at 2,743,551. The Red Sox have pulled just about this number each year in this study, and yet they are pegged as pulling roughly 500,000 fewer fans than expected by the model. I'm certain that if their ballpark had a higher capacity, they'd perform much better in this analysis.
A solution to this would be to look at total revenue for the teams, rather than just attendance. I have yet to come up with these data, although I hear that Forbes magazine publishes annual financial reports on MLB teams. In future work, I may take those figures and use them in lieu of attendance to see how things change.
For now, however, I'm going to leave this where it is. This has been a fun exercise, but I've taken it as far as I really care to for now. If folks are interested in fiddling more with the numbers, here is my excel spreadsheet (most stats were done in SAS or NCSS). All I ask is that you provide credit should you use it in your own projects. Thanks, JinAZ
Saturday, March 25, 2006
Reds sign outfielder Alex Sanchez
Today, the Reds signed outfielder Alex Sanchez, 29 years old, to a minor league contract. Aside from having tested positive (with some incredibly lame excuses...) for steroids, I know nothing about him. But let's look at some stats:
His only season in which he performed well was the most recent, but that was in only 172 AB's. For his career he's struck out 233 times and walked 76 times, a 3:1 ratio. Not great for a speed guy. Furthermore, his speed has thus far been largely ineffectual, as he's under or (at best) around the 67% mark, which is the point at which stealing bases switches from being costly to advantageous.
I haven't seen a ton of fielding information on him as he played so little last year. Baseball Prospectus has him ranging from -8 to 0 runs above average in centerfield over the past 3 years. Chris Dial's ZR translations have him at -22.7 runs above average last year in CF (note the "-" signs on those numbers). All in all, I don't think this guy can help us much, especially with guys like Freel or Denorfia also able to play centerfield. -j
| Year | Team | AB | 2B | HR | OBA | SLG | OPS | GPA | SB | SB% |
| 2003 | MIL/DET | 557 | 23 | 1 | 0.319 | 0.363 | 0.682 | 0.234 | 52 | 68% |
| 2004 | DET | 332 | 9 | 2 | 0.335 | 0.386 | 0.721 | 0.247 | 19 | 59% |
| 2005 | TB/SF | 176 | 11 | 2 | 0.353 | 0.432 | 0.785 | 0.267 | 8 | 62% |
His only season in which he performed well was the most recent, but that was in only 172 AB's. For his career he's struck out 233 times and walked 76 times, a 3:1 ratio. Not great for a speed guy. Furthermore, his speed has thus far been largely ineffectual, as he's under or (at best) around the 67% mark, which is the point at which stealing bases switches from being costly to advantageous.
I haven't seen a ton of fielding information on him as he played so little last year. Baseball Prospectus has him ranging from -8 to 0 runs above average in centerfield over the past 3 years. Chris Dial's ZR translations have him at -22.7 runs above average last year in CF (note the "-" signs on those numbers). All in all, I don't think this guy can help us much, especially with guys like Freel or Denorfia also able to play centerfield. -j
Traffic
Tonight, my wife and I watched Traffic. I saw it when it originally came out, but found it far more powerful this time around. Very, very impressive film.
One thing I did not notice before is how prominently baseball figures into the movie's symbolism. Baseball is purity and safety--what life should be without drugs and the violence that accompanies them. The movie both begins and ends with children playing baseball. It's amazing how moving something that simple can be after witnessing so much horror.
I'm tempted to use this to segway into a statement about how I angry I am that drugs have tainted this sport these past years. I could even time such a statement with the Reds' recent acquisition of the previously-banned-for-using-drugs Alex Sanchez. But I think all i want to say is how much I love this game. It's not the players, it's not even the Reds. There's just something inherently beautiful about baseball, be it the wind-up of the pitcher, the swing of a batter, or the grace of an infielder turning a double play. I'm excited for the season to begin. Let's play ball. -j
Friday, March 24, 2006
Choi claimed by Boston
BrooklynRedz over at RedsZone spotted this tidbit, possibly off of ESPN's transaction wire:
I promised I'd stay on the Krivsky bandwagon this year, but I just don't get this any more than I get the Womack/Howard trade (granted, that was not Wayne's fault). Maybe he's just too focused on the LaRue/Penny trade (rumor)... So tip of the hat to Theo Epstein et al over in Boston. We'll get you some day!! ::shakes fist::
-j
Claimed first baseman Hee-Seop Choi off waivers from the Los Angeles Dodgers.I mentioned in an earlier post that I thought Choi would be a great choice for our starting 1B if he truly was available via the waiver wire. Honestly, I'm shocked by this. The Reds would have had waiver priority over the Red Sox due to their winning record last year, which means the Reds simply passed on Choi. I just don't get it. He's cheap ($700k as I recall), has potential, and was free. This is a guy who hit 0.271/0.389/0.500/0.889 with 15 HR in 338 AB's just two years ago and is just 27 years old. His PECOTA 2006 projected VORP (17.6) is higher than Aurilia (10.2), Womack (-8.6), Freel (6.2), LaRue (9.3), Denorfia (10.0), and Hatteberg (0.0)...despite Choi playing at 1B, which has the best hitting replacement player comparison.
I promised I'd stay on the Krivsky bandwagon this year, but I just don't get this any more than I get the Womack/Howard trade (granted, that was not Wayne's fault). Maybe he's just too focused on the LaRue/Penny trade (rumor)... So tip of the hat to Theo Epstein et al over in Boston. We'll get you some day!! ::shakes fist::
-j
Denorfia, Germano, Gosling, and Bong cut
From Marc:
As for Denorfia...well, I'm not crazy about this one. As I've said before, my preferences would be to have Denorfia start in CF, Griffey in LF, and Dunn at 1B. I think Denorfia is likely to be as good offensively as Hatteberg (our current 1B) this year, and should be an average/plus center fielder. Improving our outfield defense would be a nice plus for our flyball-prone pitching staff. And despite Narron's statements, I've seen little indication that Hatteberg is that terrific of a defender at 1B. But, given his relatively young age, it probably is better for Chris to continue to play every day rather than warm the bench up in Cinci. I look for him to continue to produce in AAA and join the big league club as a starter when an outfielder gets hurt.
As for Bong, the guy's been hurt for a long time now. He's pitched well this spring, in limited appearances with both Team Korea and the Reds (he's yet to allow a run in ~5 innings of work over many games). I look for him to go down to AA or AAA and have a good year to get his career back on track. He could yet be a useful lefty out of the bullpen as Mercker & Hammond get old and retire in future years. -j
SARASOTA -- Four more guys are out, none of them surprises (at least from my roster projection).Pretty big cuts came today, though I'm going to agree with Marc that none are particularly surprising. Gosling and Germano's fates were sealed with the Arroyo trade, as they were previously battling for Paul Wilson's (injury) slot in the rotation. I would not be surprised to see either of them in our rotation at some point in the season, however. I do think it will be very good for Gosling, in particular, to get some innings at AAA and try to have a solid year down there, as he's been roughed up for the last few years everywhere he's pitched (probably due to being rushed by the pitching-starved D-backs). Germano...well, he doesn't have as much to prove at AAA, but he can at least demonstrate his consistent AAA performance thus far has not been a fluke. I do think he can help us this year, especially if we have injury problems.
Michael Gosling, Justin Germano and Chris Denorfia have been optioned to Louisville. Jung Keun Bong was reassigned to minor league camp.
As for Denorfia...well, I'm not crazy about this one. As I've said before, my preferences would be to have Denorfia start in CF, Griffey in LF, and Dunn at 1B. I think Denorfia is likely to be as good offensively as Hatteberg (our current 1B) this year, and should be an average/plus center fielder. Improving our outfield defense would be a nice plus for our flyball-prone pitching staff. And despite Narron's statements, I've seen little indication that Hatteberg is that terrific of a defender at 1B. But, given his relatively young age, it probably is better for Chris to continue to play every day rather than warm the bench up in Cinci. I look for him to continue to produce in AAA and join the big league club as a starter when an outfielder gets hurt.
As for Bong, the guy's been hurt for a long time now. He's pitched well this spring, in limited appearances with both Team Korea and the Reds (he's yet to allow a run in ~5 innings of work over many games). I look for him to go down to AA or AAA and have a good year to get his career back on track. He could yet be a useful lefty out of the bullpen as Mercker & Hammond get old and retire in future years. -j
Greg Tamer Previews the Reds
Greg Tamer has posted two notable previews recently about the '06 Cincinnati Reds.
First, last week he wrote the annual "Looking Forward to..." piece about the Reds over at Baseball Think Factory. It's as thorough a preview of the Reds as you'll find, with good recaps of all the recent ownership/management changes, as well as good looks at all the players. I have to say, though, at times it seems like he's desperately trying to be negative (see Encarnacion, Lopez, etc).
Second, at the Hardball Times, Tamer asks Five Questions about the Reds. It's a decidedly different preview, full of fun stat/history exercises, and Tamer seems almost desperate to be positive in this one. :) You're bound to learn something there--I'm particularly fond of the three true outcome piece on Adam Dunn, though the recap of our recent pitching drafts was...chilling. As an aside, we've had so much bad luck in the past several years, I can't help but think it's bound to turn around with guys like Homer Bailey, Travis Wood, and Wirfin Obispo coming up in the system. Of course, that's the same logic I used last time I was at a blackjack table, and you can guess how that turned out...
Oh, and Tamer -- thanks for the link! -j
A promising Reds' high school pitching prospect
Kevin Goldstein at Baseball Prospectus did a feature article on 10 high school pitchers from last year's draft that have a) good velocity with some control, b) a plus secondary pitch, and c) sound mechanics--all aspects that are desirable when trying to forcast a high school pitching prospect. The 10th guy listed on there was a Cincinnati Red, though it's not the one you're probably thinking of:
Edit: Tip of the hat to Ken, who noticed this (and mentioned it over at Red Reporter) before I posted it here. :) -j
The SurpriseLike JD, I cannot wait to see what this guy does this year.
Travis Wood, lhp, Reds
Drafted: 2005, second round
Velocity: Plus, especially for lefthander
Second Pitch: Plus-plus changeup
2005 Debut: 1.29 ERA in 49 innings with 67/20 K/BB ratio
The Good: As an Arkansas prep star Wood was seen by scouts primarily as a raw lefthander whose primary skill was the ability to throw hard, and even the Reds seem shocked at his initial success and polish. Wood began his career with 17.2 scoreless innings over six games, allowing seven hits and punching out 31. He showed little sign of slowing down when promoted to the Pioneer League, limiting opposing batters to a .174 average.
The Bad: While it is rare to find a teenager with an advanced changeup, Wood still needs a breaking ball, and he's yet to acquire a feel for the pitch. Short (6-foot) and slight of frame, he offers little projection.
The Immediate Future: Wood will pitch for Low Class A Dayton.
Edit: Tip of the hat to Ken, who noticed this (and mentioned it over at Red Reporter) before I posted it here. :) -j
Twins discourage power hitters?
Aaron Gleeman posted this interesting article on his blog regarding the Twins offense. It is true that they haven't had much in the way of power hitting offense in recent years, and the article indicates that the Twins may even discourage players from hitting for power. Given that Krivsky has been a major part of that organization over the years, it's something a Reds fan should pay attention to.
The Reds play half of their games in a park that favors home runs and disfavors singles, doubles, etc -- making for a net neutral ballpark (park factors I've seen range from 0.993 to 1.010). Therefore, the Reds will be best served by ground-ball pitchers, solid infield defense, and an offense built around power. In contrast, the Twins play on astroturf in a more uniformly neutral ballpark. The astroturf increases the value of groundball hitters, and may favor fly ball pitchers. This means that the optimal team for the Reds will be different from that of the Twins. I'm sure Krivsky realizes this--he's a smart guy--but scouting preferences and player development philosophies may die hard. I've got nothing against hitting to the opposite field on a two-strike outside pitch, but Reds players with at least modest power should absolutely be encouraged to try to pull the ball when they get a fat pitch out over the plate.
I'm high on Krivsky, and unless some astonishingly silly things happen over the course of the next few seasons in terms of player management I'm going to stay upbeat on the guy. I think any general manager deserves two seasons to start getting things going in the right direction (DanO had those two seasons, and was thoroughly unsuccessful). By the third or fourth, the team should be noticeably improved. And there's a way in which I don't care how Krivsky does it; I can deal with low power production, etc, if we actually do WIN. That said, the player development strategies the Reds use are still worth paying attention, if for no other reason than so we can better cheer Krivsky and crew on as they build us a winner. :)
Thanks to Baseball Musings for the link. -j
Woes in advertising
 So I just noticed that, for better or worse, my little google advertisement thing up top is now working. And to my horror, this (see right) is the very first thing I saw.
My God. How can I possibly be taken seriously when I write about Cincinnati Reds baseball when I've got a bleedin' Tony Womack Jersey advertisement at the top of my page?? If it doesn't change soon, I'll just ditch this whole ad thing altogether. -j
Thursday, March 23, 2006
The Onion on the WBC
I love The Onion:
Injury-Free U.S. Team Deems World Baseball Classic 'A Complete Success'
Ichiro: 'The Best Part About Playing For My Country Was Not Playing For The Seattle Mariners'
Injury-Free U.S. Team Deems World Baseball Classic 'A Complete Success'
ANAHEIM, CA—Players on Team USA, along with MLB owners and managers, rejoiced Thursday night following their final game of the World Baseball Classic, a 2-1 loss to Mexico, as the Americans came out of the tournament safe, sound, and in one piece. "There is an amazing sense of accomplishment among these healthy, injury-free players. Wearing this uniform, and not getting hurt while inside of it, will be something these players are going to remember for the rest of the regular season," said Team USA manager Buck Martinez while helping each player navigate an awkward step up into the clubhouse. "We didn't emerge victorious, but we did emerge completely unscathed. I say we are the real winners here." Following their elimination from harm's way, Martinez joined his 30 healthy players in a cautious locker-room celebration, during which they gingerly spritzed shatterproof plastic bottles of champagne on each other.
Ichiro: 'The Best Part About Playing For My Country Was Not Playing For The Seattle Mariners'
SAN DIEGO—In an interview following Japan's 10-6 victory against Cuba in the World Baseball Classic championship game Monday, Ichiro Suzuki called the tournament a "great opportunity to represent anything besides the Seattle Mariners." "Playing alongside my countrymen on the world stage was nice, but the highlight of the event for me was not having to watch helplessly from the on-deck circle as [Seattle outfielder] Willie Bloomquist pops out for the fourth time in one game," said Ichiro, who has been contemplating a return to his non-Mariner roots since late 2003. "Honestly, I would have played for the Netherlands team if it meant 17 days away from the Mariners spring-training camp." Although he said that the legendary Sadaharu Oh did a fine job coaching Team Japan, Ichiro added that "next to Mike Hargrove, any idiot in a baseball cap would seem like a decent manager."
Wednesday, March 22, 2006
Royals get an all-star game
So the Kansas City Royals have secured an all-star game between '10 and '14, provided they get their stadium renovations done. The Reds, on the other hand, have had a sparkly new stadium since '03 and, to my knowledge, are not even in competition for this venue. Anyone have any insights?
More on Soriano - the legalities
Maury Brown posted an excellent analysis of the Contract Binding Agreement that all major league players sign in light of the Alfonso Soriano vs. Nationals argument. I recommend you go there for his (better) analysis, but here's my take (and I'm no lawyer, though I do watch Boston Legal):
The player agrees to the following statements:
I certainly feel for the guy. He wants to play 2B, and he has every right to express this to management. But ultimately he doesn't get to make that decision. Ballclubs have the right to decide who plays where and when for them; that is how teams are able to make decisions to allow themselves to compete. It's a strange business, but I really do think this is fundamental to allowing clubs to do what they need to do to win baseball games.
Of course, this all may now all be a moot point, as Soriano has agreed to play left field this year, though somehow I wouldn't be surprised to see these issues come up again in the future. And, as I said before, it never should have come to this. This all should have been settled behind closed doors when the Nationals first acquired their talented young slugger. But Bowden never has been one for tact and decency. -j
The player agrees to the following statements:
- "The Player agrees to perform his services hereunder diligently and faithfully, to keep himself in first-class physical condition and to obey the Club's training rules, and pledges himself to... conform to high standards of personal conduct, fair play and good sportsmanship."
- "The Player represents and agrees that he has exceptional and unique skill and ability as a baseball player; that his services to be rendered hereunder are of a special, unusual and extraordinary character which gives them peculiar value...and that the Player's breach of this contract will cause the Club great and irreparable injury and damage."
- "The Player agrees that, in addition to other remedies, the Club shall be entitled to injunctive and other equitable relief to prevent a breach of this contract by the Player, including, among others, the right to enjoin the Player from playing baseball for any other person or organization during the term of his contract."
- "Nothing in this Agreement shall be construed to restrict the rights of the Clubs to manage and direct their operations in any manner whatsoever except as specifically limited by the terms of this Agreement."
I certainly feel for the guy. He wants to play 2B, and he has every right to express this to management. But ultimately he doesn't get to make that decision. Ballclubs have the right to decide who plays where and when for them; that is how teams are able to make decisions to allow themselves to compete. It's a strange business, but I really do think this is fundamental to allowing clubs to do what they need to do to win baseball games.
Of course, this all may now all be a moot point, as Soriano has agreed to play left field this year, though somehow I wouldn't be surprised to see these issues come up again in the future. And, as I said before, it never should have come to this. This all should have been settled behind closed doors when the Nationals first acquired their talented young slugger. But Bowden never has been one for tact and decency. -j
Tuesday, March 21, 2006
Is Hee-Seop Choi Available for Cheap?
Hee-Seop Choi may be leaving the Dodgers soon:
(EQBA is the projected park-adjusted batting average, EQOBP is projected park-adjusted OBP, etc. EQA is a projected park-adjusted metric of total offense, adjusted to the same general scale as batting average. VORP is another overall measure of performance, given in as Value over Replacement Player, and is park-specific.) Projections are just projections, though the PECOTA ones are based on comparable players...which included David Ortiz... If nothing else, he's still a guy that has a lot of upside. Whereas Hatteberg is a known, and very mediocre commodity. -j
The strapping first baseman who was once long on potential but is now woefully short on results has a one-year, $725,000 contract. But a loophole that applies to most one-year deals would allow the Dodgers to pay Choi just 45 days' salary - about $178,000 - if they release him by March 29, something they could do only if he clears waivers between now and then.
All of which would seem to suggest the enigmatic Choi won't be a part of the Dodgers' organization when the Opening Day roster is set.
I doubt there are many who would disagree, but I'd take Choi any day over Hatteberg. Maybe we'll get a shot at him. He'd be a brilliant waivers pickup given our new hole at 1B. And if not waivers, maybe he'd come cheap in a trade. LA certainly doesn't seem to value the guy.
Check out his PECOTA projections for the this year (Hatteberg and Casey shown for comparison):
| Name | EQBA | EQOBP | EQSLG | EQA | VORP | Defense |
| Choi | 0.27 | 0.371 | 0.511 | 0.291 | 17.6 | 0 |
| Hatteberg | 0.261 | 0.347 | 0.373 | 0.247 | 0.0 | -4 |
| Casey | 0.306 | 0.365 | 0.450 | 0.275 | 19.3 | 0 |
(EQBA is the projected park-adjusted batting average, EQOBP is projected park-adjusted OBP, etc. EQA is a projected park-adjusted metric of total offense, adjusted to the same general scale as batting average. VORP is another overall measure of performance, given in as Value over Replacement Player, and is park-specific.) Projections are just projections, though the PECOTA ones are based on comparable players...which included David Ortiz... If nothing else, he's still a guy that has a lot of upside. Whereas Hatteberg is a known, and very mediocre commodity. -j
Subscribe to:
Posts (Atom)