
Team Performance and Attendance
To start, here is the relationship between team wins in '05 and team attendance:
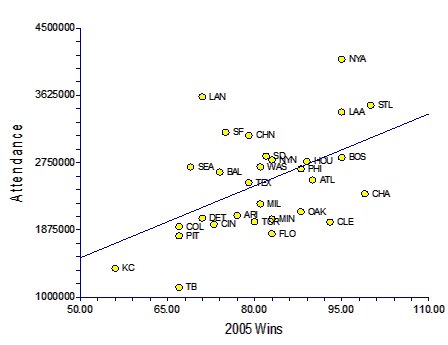 As we can see, there is a positive relationship here. This regression is significant (P=0.005), but the R^2 for the this regression is 0.25, which is lower than in our model of city population size and attendance. It's not bad, but let's see if we can do better.
Looking at the points that fall off of the curve, I noticed a few things: the Giants (SF) and the Dodgers (LAN) had much higher attendance than predicted by their win totals last year. However, last year both teams were uncharacteristically bad, whereas they had both been contenders in previous years. Perhaps we're seeing a carry-over effect from prior years' success? Therefore, I also compared attendance vs. win totals over the past 2, 3, 4, etc, years. Here are the R^2's of those regressions (higher R^2 = better explanatory power = better model):
| Runs Total Years | R^2 |
| 05 | 0.2541 |
| 04-05 | 0.4024 |
| 03-05 | 0.3958 |
| 02-05 | 0.4030 |
| 01-05 | 0.4022 |
| 00-05 | 0.3851 |
| 99-05 | 0.3748 |
There was a dramatic boost in the explanatory power of the regression model when I provided the total wins for '04 and '05 to the model, rather than just those from 2005. This model can explain 40% of the variation in attendance, which is higher than our explanatory power using city population size. There was also very slight increase when I included win totals dating back to '02. While essentially equivalent to the '04-'05 data, I decided to use the '02-'05 data going forward a) in order to achieve the best possible fit to the model, and b) because one city behaved very differently depending on which value I used (discussed below). Furthermore, it seems like four years is a good figure that captures the typical perceptions/memory of a baseball fan. For example, Cincinnati has not had a winning season since 2000, and most people (myself, a lifelong fan, included...unfortunately) do not think of them as a winning franchise. Seattle, on the other hand, has suffered through two consecutive miserable seasons, and yet I still think of them as a competitive franchise due to their outstanding run from '00 to '03.
Here is the scatterplot of the '02-'05 win totals vs. attendance:
 Note the tighter fit than in the '05-only graph. Also note that it is a nice, linear fit, indicating that an extra win for a good team is worth just about the same as a win for a poor team.
Combining the two variables to measure fan loyalty
There was little correlation between win totals and city population levels (r=0.30, R^2 = 0.09, regression non-significant), so I conducted a multiple regression analysis using both Log(City Population) and '02-'05 Win Totals as predictors of Attendance. Both were significant effects, and the resultant regression equation was:
Attendance = -4,196,660 + 667,280.3*log(City Population) + 8290.499*('02-'05 Wins).
The R^2, 0.60, indicates that this model explains 60% of all variation in attendance last year. This value is up from 0.34 for the city population model alone, and 0.40 for the win totals model alone.
Interestingly, the model predicts an increase of ~8300 fans annually for each win over the past five years. Therefore, improving a team by 10 wins should result in only about ~83,000 more fans attending in a given year. Do that 4 years in a row (for the Reds, this would mean posting about an overall 0.500 record these past 4 years), however, and you're up to 322,000 fans per year. At ~$25/fan, that's $8,300,000--just shy of Adam Dunn's average salary these next two years.
To take it a step further, the predicted attendance difference between teams that post four consecutive 90-win seasons (e.g. the Cardinals) and four consecutive 70-win seasons (e.g. the Reds) is a staggering 663,240 fans, or roughly (at ~$25/person) $16,500,000. It pays to win, especially if you can do so long term.
The Best Baseball Towns
Back to our original question of identifying the best baseball towns, here are the residuals from this analysis, which are simply differences, in terms of number of people, between actual attendance and the attendance predicted by the multiple regression equation:
| 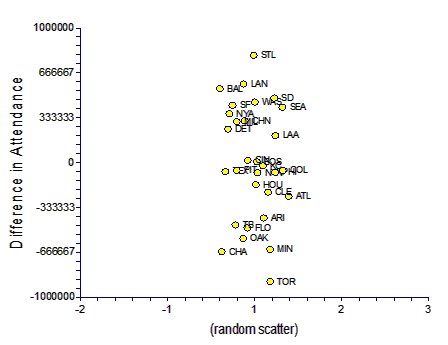 |
So where are the greatest baseball fans of all? Despite their superb performance over the past few years, St. Louis was the king of baseball towns last year, with almost 800,000 more fans than would be expected for a city of that size and a team that successful. The Dodgers, Orioles, Padres, and Washington Nationals round out the top five franchises in terms of loyalty. It will be interesting to see if the Nationals maintain this level of interest moving forward into their second year.
The worst fan base was that of the Toronto Bluejays, who have been a moderately successful team in an enormous city, and drew almost 900,000 fewer fans than expected. They were followed by the Chicago White Sox, the Minnesota Twins, the Oakland Athletics, and the Florida Marlins. All of these teams have reputations as solid franchises that don't have the fan bases they deserve. The White Sox, having just won their first World Series since 1908, should expect better times ahead. However, the Twins and A's are woefully underattended given their superb record these past years, and the Twins (at least) were candidates for contraction some years ago. The Marlins have been one of the strangest franchises in baseball since they joined the National League, fluctuating from positively horrid to World series champions several times. They are currently fighting for a new stadium South Florida, but it would not be surprising to see them move elsewhere at some point if that effort does not prove tractable. Clearly they deserve better attendance.
I mentioned above that one team behaved rather differently if one used the '04-'05 win data instead of the '02-'05 win data. The team was the Seattle Mariners, who went from superb (4 consecutive 90+ win seasons, including the unbelievable 116-win '01 season) to horrible (63 & 69 wins in '04 and '05) very recently. If one only uses the last two years' wins, Seattle would boast the best fans in baseball. The 4-year data, however, indicates that Seattle Fans are still good, but are apparently still riding the wave of their past success. Nevertheless, one has to wonder how much longer they will tolerate their teams' woes.
How did the Reds do? The Reds have the 2nd-smallest attendance residual (absolute value), indicating that our fans are almost exactly average. We drew 14,751 more fans last year than expected (182 more per home game) for a city our size (Cinci is small) and a team this bad (5 consecutive losing seasons). It's actually pretty good news. We're not Minnesota or Tampa Bay. If the team starts winning, there's reason to expect that attendance will increase in a manner consistent with our team's performance. Here's hoping the momentum that started his offseason with Castellini and Krivsky will carry over into good decisions about the ballclub and a terrific increase in performance over the next 4 years.
Future directions
I have plans to continue this work in a few directions:
- The R^2 of 0.60 is decent, but I would like to see if I can increase it further still. I can think of a several other factors that might result an attendance boost: a new stadium, postseason appearances, changes in ownership/front office/management, the signing of a big free agent, etc. The beauty of the regression models is that we can assign actual attendance values to each of these items.
- I would also like to partition out the 4-year win totals into separate effects for each season; how valuable was a win in '05 compared to a win in '02?
- Finally, I'm interested to see how fan loyalty has changed over the years in different cities. One way to do this would be to plot attendance residuals of teams over time -- say in '05, '00, '95, '90, '85, etc. I would expect to see fan loyalty change over time. This'll require a fair bit of work, but I think it would be fascinating.
Wow. Great insights.
ReplyDeleteTo me, the most surprising item here is that the Boston Red Sox have--statistically--the most-average local fan base, with the smallest residual attendance (absolute value). Say what you want about the diehards in Red Sox Nation, but the locals are not significantly more dyed-in-the-wool than anyone else, given the various factors that went into your analysis.
Thanks, J.
I hate to poke holes in this, but Boston's one of the few that I'm a bit wary of right now in this analysis. Fenway Park has the lowest capacity of any ballpark in the major leagues at 33,871, which gives a maximum attendance (assuming 81 games) of 2,743,551/year. Their attendance last year was 2,813,354, which is higher than should be possible (not sure if that includes postseason or not). If nothing else, it indicates that attendance in Boston has probably peaked until they get a new park. I wouldn't be surprised to see them up near the leaders once they move. But who knows? -j
ReplyDeleteThat makes a lot of sense. I can't wait to see how the new-stadium factor plays out in your further analyses. Thanks again.
ReplyDeleteI did a little bit of playing around with the stadium age data, but it's not looking too promising.
ReplyDeleteI tried adding the years since a stadium was built or massively remodelled into the analysis. As it turns out, there was very little relationship between this new variable and attendance (non-significant, P=0.56), even after controlling for city size and winning. I also tried eliminating Fenway and Wrigley from the dataset since they are somewhat odd cases.
I think the problem is that there is really very little spread in the data. 16 teams have built new stadiums since the Camden Yards was built in '92, which is often credited with setting off the new stadium craze (although the White Sox and the Blue Jays received new stadiums in '89 and '91), which is over half of all teams.
I'm also not sure how long the attendance craze lasts. Maybe it's only detectable for a few years? A better evaluation of this would be to compare attendance before and after each new stadium to see how much a boost they cause. I'll probably revisit this at some point, but for now I'm going to put it on hold. :( -JinAZ
Also, thanks for the feature on your page! It's very flattering and appreciated (even if I am nutty! :> ). -j
ReplyDelete"Nutty" only in a relative sense, and speaking as one nut to another.
ReplyDeleteWhen one considers the fiasco of new stadiums in Milwaukee, Pittsburgh and Cincinnati ("if you build it, we will win"), the statistical insignificance of that factor seems to make sense. I was hoping that we were the exception, though.
I wonder if it's related to how early each team jumped on the new stadium bandwagon. Baltimore and Cleveland, first movers in the retro-stadium trend, both had enormous spikes in attendance and performance after their new stadiums were built. But as you say, Chicago and Toronto had new stadiums even earlier than that. Hmmm...
(I'm not sure that Toronto counts, since SkyDome is essentially an upgraded multi-use stadium like the cookie-cutter trio of Busch, Riverfront and Three Rivers. Not exactly cutting-edge in ballpark experience, retractable roof or not.)
Well, looking at the Reds' attendance figures, it looks like they even got something of a boost in attendance, albiet nothing comnpared to what Cleveland or Baltimore got after their stadium opened. I've got an idea of how to pursue this bit further, though it's not using these linear models. I'll try to work it up over the weekend, as I'm getting pretty curious about it. :)
ReplyDelete