Table of Contents

Thursday, August 06, 2009

@BtB: Value to Fans, Power Rankings

Two new posts over at BtB.

First, I updated my power rankings. The Reds are now ranked last in all of baseball. That freaking sucks--good thing it only matters to my spreadsheet.

Second, I revisited a topic that I've looked at once before: which teams offer the most value to their fans? I look at Fan Cost Index (essentially the cost for a family of four to visit the ballpark--tickets, parking, food, drinks, souviers, etc), and compare it to winning percentage. I also explicitly look at beer cost, because beer is fun.

The Reds come out looking pretty decent this year, even though the team stinks. Based on a regression, their Fan Cost is $33 less than expected, based on team winning percentage. If you use the BtB Power Ranking estimated winning percentage, the Reds' FCI comes out $9 less than expected. Still above-average, though not as much. But then, the Power Rankings aren't kind to our Redlegs.

The Reds' beer is also cheaper than expected, though only by a few cents. Good thing--we need it.

Hat Tip to ctrent for the link to the latest FCI stuff.

Farewell to Hal McCoy

One of the better baseball writers I've had the pleasure of reading, even if I agree with him only about half the time, will be leaving us at the end of the season. And not by his choice.

We're down to John Fay and Mark Sheldon. Both great guys and good writers, but neither quite has Hal's creativity with the pen. We'll still get our Reds news. But the fewer reporters we have, the harder it will be to get something more than what is in the day's press releases, or what Dusty wants to talk about in his daily meeting.

This recession shit sucks.

Wednesday, August 05, 2009

Reds Futility, Visualized

This is one of the worst stretches that I can remember as a Reds fan. Here are some graphical looks at how bad it's been.

Sparkline, via THT:

In this case, the Red marks indicate wins (or losses) of four runs or less. So they haven't been blowouts. But still. Yikes.

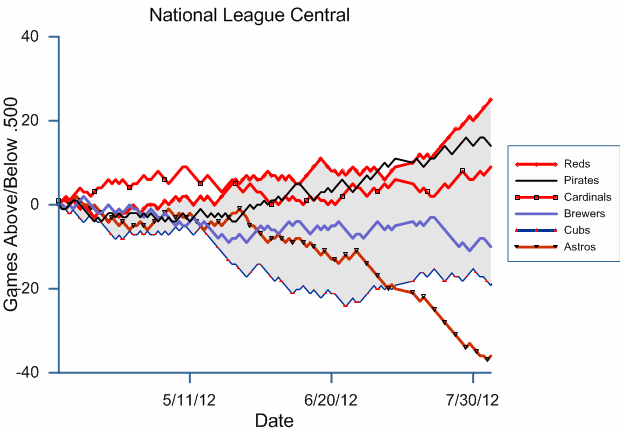
+/- 0.500 graph, via THT:

Not horrible 'til the All-Star break, then KerBloom!

And these don't illustrate the terribleness of the Volquez injury news...

::sigh::

Monday, August 03, 2009

Understanding Surplus Value

Play's to firstJoey Votto is not only the Reds' best player, but also one of their cheapest players. Image by phillenium1979 via Flickr

In the Rolen trade analysis, I spent much of my time evaluating "surplus value" in my assessments of the players involved. This is not the first time I've posted about this, though perhaps it's the highest profile case of this sort. It is, however, becoming a more mainstream approach to analyzing trades (see, for example, Sky's Trade Value Calculator). I thought I'd take a stab at explaining this concept, and how it has been extended to prospect valuation.

The core of it is understanding the connection between player value and payroll.

The major league minimum this year is $400k. You need 25 guys on your team (assuming no injuries, etc...), which means the minimum possible payroll in MLB right now is $10 million ($400k * 25). How well would such a team perform? Well, if you use that $10 million exclusively on free agents, you're not going to get very good players--mostly guys who can't get a job anywhere else, minor league free agents, etc. Those guys are essentially the definition of replacement players, and we generally assume a team full of replacement players will play around 0.350 ball, which amounts to 57 wins per season (you'll see other figures around the 'net--which one you choose doesn't change what I'm about to do qualitatively).

On the other side of the coin are the New York Yankees, who began this season with a $201 million payroll. From other work, we know that each win above replacement cost roughly $4.5 million in last offseason's free agent market. Therefore, if the extra $191 million they're spending above the minimum was invested in free agent salaries, they could reasonably expect to win $191/$4.5 = 42 extra wins above the minimum 57, or 97 wins (for what it's worth, the Yankees are on pace for 99 wins). :)

But take the Tampa Bay Rays. They began the year with a $63 million payroll. That's just $53 million over the minimum payroll. If you invested that extra money in free agents, and filled in the rest with replacement players, you'd expect they'd win another $53/$4.5 = 12 extra wins. That would equal 69 total wins. But they're on pace for 91 wins. How?

The answer, of course, is that their team is not made up of free agents. It is made up of a lot of quality, young players making far less than they would had they signed as free agents. For the first three seasons of a player's career in the major leagues, they make at or close to the league minimum. For the next three seasons after that, they are eligible for arbitration and get raises, but for a variety of reasons still get paid well below what they would as a free agent. As a result, for the first six years of a player's career, they will make less than a free agent regardless of their performance on the field.

Most teams operate under a fairly set budget. The median opening day payroll was about $81 million this year. So if a team has that budget, and spend it all on free agents, you'd expect them to win around 57+16 = 73 games. In order to win more games, teams have to have players who produce value above their salaries. For example, this year, Joey Votto has produced ~2.5 wins above replacement (worth $11.3 million on free agent market), but is making just over league minimum. If you fill your team with those kinds of players instead of replacement players, and still spend $71 million on free agents, you'll obviously win a lot more games.

That's what we're talking about when we talk about surplus value. It's the extra value a player provides above what their salary would bring on the free agent market. The keys to winning, at the club level, is 1) to spend money for good players, and 2) to get players who produce value above what their salary would predict. Most teams can't get by on #1 alone, and the easiest way to do #2 is to get young players making "slave" wages.

This is also what makes prospects valuable commodities. Prospects generally have no or minimal MLB playing time, which means that their "owners" get them for six full seasons when they will make below free-agent market rates. So, the short of it is that if you figure out how much surplus value a typical prospect type provides their team during the first six years (including assessments of how often they provide any value to their team at all--many, of course do not), that gives you a good indication of how much value to assign prospects of that type.

In Zach Stewart's case, I pegged him (as many others do) as a class-B pitching prospect. Pitchers of this sort tend to provide the equivalent of $7.3 million in surplus value over their first six seasons. Another way to think of that is that it's a total of ~1.6 wins above replacement over their first six years (only 0.3 WAR/season). Not particularly inspiring, maybe, but it reflects the fact that many class-B pitching prospects do not pan out for one reason or another. But some do, some provide a little value, and some provide a ton of value. The $7.3 million total is the typical amount of surplus value you can hope to get from such a pitcher.

Anyway, this became rather long. But if anyone made it this far, I hope it helped clarify the underpinnings of this kind of trade analysis.

Friday, July 31, 2009

More on the Rolen deal

Photo of Scott Rolen originally taken by Googi...Scott Rolen's a fine player. But was the cost too great? Image via Wikipedia

Through a strange twist of fate, I suddenly have a bit of time to spend working through today's big deal in a more careful way than I did earlier today (I have no real opinion on the Hairston deal as of now). Let's look at the players one by one.

Scott Rolen, RHB 3B
Year Age Team PA %K %BB %LD BABIP AVG OBP SLG ISO wOBA RAA WAR
2006 31.2 STL 594 12% 9% 20% 0.301 0.296 0.369 0.518 0.223 0.380 22.1 4.0
2007 32.2 STL 441 13% 8% 20% 0.287 0.265 0.331 0.398 0.133 0.327 -3.6 0.9
2008 33.2 TOR 467 15% 10% 21% 0.292 0.262 0.349 0.431 0.169 0.346 5.5 2.3
2009 34.2 TOR 373 11% 7% 25% 0.341 0.320 0.370 0.476 0.157 0.368 11.1 2.5
2009 34.2 TOR (ROS)
174 13% 8% --
0.308 0.284 0.351 0.439 0.155 0.349 2.2 0.9
2009 34.2 TOR (ZiPS)
547 12% 7% --
0.331 0.308 0.364 0.465 0.156 0.362 13.4 3.4
Rolen's had a bit of a resurgence this year, though as noted elsewhere it seems likely to be, in part, based on a "lucky" BABIP (though his LD rate is also up...though that too is also likely unsustainable). His updated ZIPS, based on stats to date and rest of season performance, put his value this season at 3.4 WAR (0.9 WAR the rest of the way). He's a nice all-around hitter, with average walk rates, nice power, and good contact ability. A big part of his problem has been injuries--he hasn't hit 500 PA's since 2006 (a full season is 700 PA's!). A weighted 3-year average of the 07, 08, and projected 09 stats puts his expected "true talent" hitting value at 2.4 WAR.

Fielding-wise, he's not what he once was, but still is a plus defender. A weighted 3-year average of his bUZR puts him at ~8 runs above average. His Fan's Scouting Report in 2008 was outstanding, rating him best in all of baseball at his position. I'll put him as a +1 WAA fielder, with the understanding that injuries can pull this value down.

So, in terms of win value (i.e. total value) the rest of this season (60/162=37% games remaining), we have:
+0.9 offense (from ZiPS Rest of Season)
+1.0 WAA * 0.37 = 0.4 fielding
+0.25 WAA * 0.37 = 0.09 position adjustment
---------------------------------------------
1.4 WAR over the remainder of this season, which is worth around $6.3M.

He's due to make $11M this season, of which I'm estimating 37% should be paid by the Reds, which is $4M. That's a surplus value of ~$2 million this season.

Next year:
2.4 WAR offense
1.0 WAA fielding
0.25 WAA position
-0.5 WAA aging
----------------
3.2 WAR Total

That's worth between $14.5 M and $16 M, depending on how the free agent market goes this offseason. He'll make $11 million, so that's ~$4 million in surplus value. Overall, we have a "property" that can reasonably be expected to provide ~$6 million in surplus value over the rest of his contract. He also fills several holes on the Reds--he's a good RHB, and solves (at least until the end of July 2010) the defensive problem at 3B. He's a good pickup. The question, of course, is the cost...

Edwin Encarnacion, RHB 3B
Year Age Team PA %K %BB %LD BABIP AVG OBP SLG ISO wOBA RAA WAR
2006 23.5 CIN 467 17% 9% 21% 0.307 0.276 0.355 0.473 0.197 0.361 9.7 2.4
2007 24.5 CIN 560 15% 7% 19% 0.322 0.289 0.354 0.438 0.149 0.353 8.3 2.5
2008 25.5 CIN 582 18% 10% 16% 0.264 0.251 0.340 0.466 0.215 0.352 9.6 2.7
2009 26.5 CIN 165 23% 15% 14% 0.250 0.209 0.333 0.374 0.165 0.322 -1.7 0.3
2009 26.5 CIN 181 19% 10% 0% 0.288 0.259 0.348 0.449 0.190 0.354 3.1 0.8
2009 26.5 CIN 346 21% 12% 0% 0.271 0.236 0.341 0.414 0.178 0.339 1.4 1.1
Eddie's had a horrible season thus far with the stick. But prior to this year, he had posted three consecutive seasons with offensive WAR's in the mid-2's. I tend to think that this year is an aberration. But to be objective, a 3-year weighted average puts his "true talent" offensive performance at almost exactly 2 WAR.

The problem with Eddie is that his fielding really hurts his value. A 3-year weighted average of his bUZR puts him as a -10 run fielder. His Fan's Scouting Report was more "positive," rating him just in the bottom third of 3B's defensively. Consensus seems to be he has a solid glove, but an awful arm--seems right to me. FSR data would put him at about a -5 run fielder. I'll split the difference and call him a -0.75 win fielder.

So, over the rest of this year, we have:
0.8 WAR offense
-0.75 * 0.37 = -0.3 WAA fielding
0.25 * 0.37 = 0.09 WAA position adjustment
----------------------------
0.6 WAR, which is worth ~$2.7 million on the free agent market. He makes $2 million this season, and 37% of that is $0.7 M. That makes his surplus value over the rest of this year ~$2 million.

Next year, we have:
2 WAR offense
-0.75 WAA fielding
0.25 WAR position adjustment
-0.25 Aging (I'm not taking off the full 0.5 WAR because he's still young; injury risk and my lack of regression still warrants a deduction)
-------------------------------
1.3 WAR, which is worth between $6-$6.5 million next year. He'll make $4.75 M, so that makes for about a $1.5 million surplus value--entirely due to the fact that he's still in his arbitration years (otherwise, his salary would be better).

So, overall, I'd rate Encarnacion as being worth about $3.5 million in surplus value. You can guestimate that he might be worth another $0.75 million surplus in his third year of arbitration (arbitration players don't make what free agents do), which would bring his value to $4.25 million.


Zach Stewart, RHP
Year Age Team GS% IP K/9 BB/9 HR/9 BABIP ERA FIP
2008 21.8 Reds (A) 0% 16.3 7.2 1.7 0.0 0.232 0.55 2.34
2008 21.8 Reds (A+) 0% 16.6 12.4 5.9 0.0 0.400 1.62 2.60
2009 22.8 Reds (A+) 100% 42.3 6.8 1.7 0.2 0.345 2.13 2.63
2009 22.8 Reds (AA) 100% 37.0 7.5 2.4 0.2 0.276 1.46 2.77
2009 22.8 Reds (AAA) 0% 12.3 11.7 5.8 0.0 0.369 0.73 2.55
Stewart was the Reds' 3rd-round selection (their second pick, as they did not have a 2nd-round selection) in the 2008 draft. He's done very well thus far and is skyrocketing through the minors. Scouting reports on him are strong, and he's put up extremely good ERA's thus far. His strikeout and walk rates have been a bit all over the place, but somehow it has all balanced out thus far in a very consistent FIP. Sickels rated him a B- pitcher prior to this season, and the consensus view is that he's a legitimate "B" pitcher now. "B" prospect pitchers are worth about $7 million in surplus value, based on their typical success rate and expected 6 years of below-market pay.

Josh Roenicke, RHP
Year Age Team GS% IP K/9 BB/9 HR/9 BABIP ERA FIP eW% WAR
2006 23.9 Reds (R) 0% 15.6 13.8 6.9 0.6 0.308 6.32 3.26 63% ---
2006 23.9 Reds (R) 0% 7.6 10.6 3.5 0.0 0.388 1.17 2.42 73% ---
2007 24.9 Reds (A+) 0% 27.6 13.3 4.9 0.3 0.373 3.25 2.44 73% ---
2007 24.9 Reds (AA) 0% 19.0 7.1 2.8 0.0 0.237 0.95 2.57 71% ---
2008 25.9 Reds (AA) 0% 22.0 11.5 4.9 0.8 0.358 3.27 3.47 59% ---
2008 25.9 Reds (AAA) 0% 39.0 9.9 3.2 0.5 0.323 2.54 2.74 68% ---
2008 25.9 CIN 0% 3.0 18.0 6.0 0.0 0.709 9.00 2.13 75% 0.1
2009 26.9 Reds (AAA) 0% 28.0 10.3 1.9 0.0 0.390 2.57 1.77 80% ---
2009 26.9 CIN 0% 13.3 9.5 2.7 0.0 0.355 2.70 1.85 79% 0.5
2009 26.9 ZiPS (RoS) 0% 17.0 7.9 4.2 1.1 0.313 4.24 4.23 52% 0.1
2009 26.9 ZiPS (Update) 0% 30.9 8.6 3.6 0.6 0.331 3.56 3.19 63% 0.5
Roenicke's been all over the place the last few years. But his profile is fairly consistent: hard thrower, very good strikeout numbers, and high-but-not-outrageous walk totals. He's in his first full season, so I think it's probably best to go with Sickels' pre-season rating for him and use that to assign value to him. Sickels gave him a B-, which I'll guess makes him worth about $4 million in surplus value, given his fairly advanced age (he's the oldest player in this deal aside from Rolen!). That's spread out over the first six years of his career.

Trade Tally
Rating strictly on surplus value, we have:

Update: Fay says they get cash to cover the rest of Rolen's 2009 salary. That would be ~$4M. I've updated the below bit to reflect that guesstimate.


Rolen: $6 million surplus
+$4 million cash(??)
vs.
Encarnacion: $4 million surplus
Stewart: $7 million surplus
Roenicke: $4 million surplus
Total: $15 million surplus

Assuming the cash sent to the Reds above is accurate, Toronto "wins" trade by ~$5 million, which is roughly the value of a bench player as a free agent.

Does this deal make sense for the Reds? You can make the argument in a lot of ways that it does. They upgrade third base by roughly 1.5 wins next season, get a good right-handed bat (though only modestly better than Eddie's), and continue to upgrade their fielding.

The problems from my perspective are two-fold. First, the Reds overpaid by roughly one Josh Roenicke (though we're admittedly within the margin of error here). Second, even if this was the market rate, they acquired a single aging, injury-prone player in exchange for cheaper, younger players. If the Reds were likely to contend this or next season, it makes sense to do. But who outside of Bob Castellini really thinks that the Reds are in that sort of position? Rolen doesn't improve them by more than 2 wins per season, tops. The Reds prior to this trade were a sub-0.500 club, and by at least one way of forecasting these things, on their way to finishing last in the division. The Reds sacrificed a small part of the future for the now, and the two wins Rolen provides don't help the now very much.

On the plus side, at least I don't have to fret about why the Reds aren't moving Edwin to the outfield anymore. ;)

Reds Acquire Scott Rolen

Update: More on this trade here.

I'm leaving town for the weekend in 20 minutes, so only a little time.

Rolen's long been an outstanding talent, with a great bat and brilliant glove. He's also been someone who has a hard time staying healthy, which hurts his value. He's had a WAR of 2.5, 3, and by this season's end 3.5 to 4. I think it's safe to call him a 2.5-3 WAR player next year. That's worth somewhere around $11-15 million next year. He's paid $11M next yea, so it's fair value, possibly with a small surplus up to $4 M depending on the market.

Eddie has been a 1.5-2 WAR player, but might be lucky to post 1.5 WAR this year. I'll call him 1.5 WAR for next year. Hitting-wise, he's valuable. But the fielding kills his value, and I've long since given up hope he'll get much better. Eddie makes 4.75 M next year in his final arbitration year, while his value should be in the $5.5-6.5 range (again, depending on market).

So, if it was a 1:1 trade, it'd favor the Reds slightly, I think--we take more salary, but upgrade talent and (probably) get a larger surplus.

The question now is who the minor leaguer is. Alonso is a top-25 hitter, I think, which puts his value at ~$25 M. (if just top-50, $23 M). That would swing the deal in a HUGE way to Toronto. Latest reports are that he's not included.

Zach Stewart I don't know how to rate. If he's a top-100 pitcher, he's ~$10 M. Grade B, he's $7 M. Either way, favors Toronto, though not as bad as initial reactions...only by a few million or so. Roenicke is maybe another 1 WAR, which is ~$4.5 WAR.

So yeah, I think Toronto wins by $6M in value or so. Not a disaster, but not good. I don't like this deal. Rolen's old, still a good player, but he's not going to make this team a contender next year. And how much longer will he play? Will he be healthy?

Have to run. :(

Thursday, July 30, 2009

Mailbag: Pitching Questions

SAN DIEGO - MAY 15:  Starting pitcher Aaron Ha...What is wrong with Harang this year? Image by Getty Images via Daylife

Had a few questioins arrive in the inbox. Questions may be paraphrased, and since I didn't ask permission to post them, they are anonymous (feel free to chime in if you wish).

Reader #1:
What is your take on Aaron Harang? Has he collapsed, or is he just unlucky?
Note: most of what follows is from Harang's player pages at FanGraphs.

Comparing the 2008-2009 Harang to the 2006-2007 Harang, there are two substantial differences I see. First is a decline in his strikeout rate from the mid-8 k/9's to the mid-7 k/9's. The second thing I see is a decline in ground ball rate from 39% or so to a fairly Milton-like 35%. All the while, though, his walk rate has stayed pretty constant--maybe a slight uptick, depending on how you measure it. But nevertheless, he still has a very fine k/bb rate, even if not as good as it used to be.

I recently read something about his slider's vertical movement having vanished. There is a pretty steep decline in slider vertical movement between 2007 and 2008/2009, which corresponds to a big drop in his slider's run value. Looking at this graph, it seems as though it happened about three starts before his DL stint. So there absolutely could be something to that, and it could explain why his strikeout rates have dropped a fair bit of late. But then again, there's an increase in horizontal movement in his change-up over the same time, without much change in its run value.

The various DIPSish metrics are mixed on him. His FIP is up from 3.7 to 4.4 or so, which is a steep climb. But his xFIP, which is a better predictor of future performance, is up only slightly, from 3.8 to 4.1 or so. So that's encouraging.

His tRA has gone from 3.75ish to 5.1 or so (yikes). But his tRA*, which includes appropriate regression and thus is a better predictor than tRA of future performance (FIP:xFIP::tRA:tRA*), has "only" increased from 4.1 to 4.9 or so. Again, not as bad as the unregressed data, though clearly not the level of performance we saw from him during 2006-2007.

He's essentially performing right at his ZiPS projection this year, which I would have said was pessimistic. Not surprisingly, his ZiPS the rest of the year is unchanged. That's the only projection system I have access to that gives in-season updates, but I think all the other projection systems (which had Harang in the 4.0-4.2 ERA range) will be closer to 4.35 ERA or so.

So I think the message here is that, at this point, Harang is still a quality starter, and can be expected to post something close to a league-average ERA (which is still a bit above-average for a starter). I'd put his expected WAR at around 2.5 to 3 by season's end, and probably about 2.5 next season. That's a quality pitcher. Not the 5 WAR beast he used to be, but still a good pitcher.

He's being paid $11M this year (expected 2.5 WAR) and $12.5M (~2.5-2.7 WAR, depending on the market) next year, which means he's pretty much being paid appropriately. No problem there either.
Reader response: Something you haven't mentioned is that Harang's DER is 2nd worst in the majors. I'd like to see some study on the affect that has on a pitcher's overall numbers. The reason is because if there is a pitcher that is getting less help from his defense, will his other numbers naturally decline simply because of the extra effort it takes to get through an inning. Put another way, a pitcher who basically has to get 3.5 outs an inning might be more likely to give up home runs or other hits than one that only has to get 3 outs an inning.
I didn't directly address the DER issue, though I did notice it. My feeling is that this year has to be luck-induced, as opposed to fielding induced. It's his worst DER of his career, but at least as far as Reds teams go, this has been the best defense he's ever had playing behind him. Granted, maybe there were some screw-ups while he was on the mound gven the small sample, but it makes no sense that his DER would get worse as his team's fielding undergoes a massive transformation unless it's largely a timing/"luck" issue.

Reading this again, I sort of missed the point as far as the psychology issue is concerned. My feeling is that you're right about it, but I don't know what the effect size is.

The next question comes from a different reader:
I am wondering if there is any way you could address this question/issue on your blog or maybe on BTB if you think it is interesting enough. You probably know about the Reds starters' struggles in the 1st inning of games this season. The stats, closely approximated about as near as I can tell are the following:

Bronson Arroyo: 9.46 ERA, 1.080 OPS
Aaron Harang: 7.36 ERA, .870 OPS (OPS worse after today's start against the Padres)
Johnny Cueto: 9.00 ERA (slightly worse), 1.150 OPS
Micah Owings: 7.50 ERA, .860 OPS
Edinson Volquez: 7.00 ERA, .913 OPS

Also, Harang, Cueto, and Arroyo are 3 of the top 5 worst pitchers in the league in BAA the first tie through the order, and the Reds have by far the worst 1st inning run differential in all of MLB. So my question is, do you have any idea or insight into why this might be? Any explanation for it at all? This phenomenon is very perplexing to me, as is the fact that apparently no adjustments are being made to correct it.

I honestly have no clue. Most teams do worse in the first inning than any other inning, simply because that's the only inning where you are guaranteed to see at least one (and often more) of the other team's best hitters. But why the Reds might be especially bad during the first inning isn't something I have an explanation for, unless they're not warming up enough or something (very unlikely, I'd think). Especially because the Reds rotation, while not awesome, isn't bad either.

It's not like the 8th-inning problem the Reds had a few years back, where the problem was that the Reds didn't have anyone competent enough to get the ball to Weathers in the 9th. There was a clear explanation for what we saw that year.

My honest guess is that it's noise. But I can't think of a clear way to test that further that would provide any sort of clear answer. Maybe some of the pitchf/x'ers can look at pitch motions and velocities in different innings and identify an issue. But that's not in my bag of tricks, at least not yet.

Sorry, that's the best I can do.