Table of Contents

Monday, June 01, 2015

Minor League Guy I Noticed: Seth Varner

I ran across Seth Varner today while looking around at Reds minor league numbers.  He was the Reds' 2014 10th-round selection out of Miami University in Oxford, and hails from Batavia Ohio.  And he's absolutely carving up the Midwest League right now:

He's actually a nice example of why using K%-BB% is safer than K/BB ratio: his K/BB ratio is a ridiculous 14.0 right now, whereas his K-BB% is a less ridiculous, but still very-commendable 23%.  He just isn't walking anyone, and he's getting plenty of strikeouts.  His .350 BABIP is a bit high given his other performance, and accounts for the FIP-ERA gap.  So, by the stats, we have a lefty with outstanding control, excellent strikeout rates, and just one year removed from his drafted season.  And he's not on anyone's prospect lists.

So, I popped Doug Gray a tweet.  Dutifully, he gave a nice response:

I guess that explains it!  In a subsequent tweet, he did point out that he's a lefty, so maybe he's got a shot at a relief role someday.  But apparently I didn't identify the Next Big Thing, probably.

I'll still be cheering for him!

Ben Lively Check-In

Last winter, the Reds traded Ben Lively to the Phillies last season after a ridiculous-good year in the minors (and reservations from scouts).  This year, they started him again at AA (he'd only logged 72 innings there in 2014), and he's off to a solidish start.  His strikeout rate is down, but so-too is his walk rate compared to last year in Pensacola:


Time will tell if he is able to survive in the major leagues.  I don't have any ill will toward the guy, but it is a little...gratifying?...to see him struggle a little bit.  It is consistent with the scouting reports on him as a good example of a polished college pitcher dominating lower ranks of the minor leagues with command and pitchability, but with stuff that won't play as well at the higher levels.  That's why the Reds traded him; his value, they thought, was never going to be higher.

Wednesday, May 27, 2015

MLB Power Rankings: May 27th, 2015

With methods described in this post, here are the latest MLB power rankings!


TPI = Team Performance Index (my ranking metric).  Based on wRC, DRA, DRS, and UZR.
W% = Team Winning Percentage (i.e. real life)
Py% = Pythagorean Winning Percentage (based on real RS and RA)

On-Paper Playoff Leaders

American League - East: Rays, Central: Tigers, West: A's, Wild cards: Royals and Blue Jays
National League - East: Nationals, Central: Cardinals, West: Dodgers, Wild cards: Giants and Cubs


Notes

The Reds and White Sox were the big fallers this past week+ in terms of TPI, with both teams basically cratering.  I'm still pretty surprised at how bad the White Sox have been.  The Reds will hopefully rebound, a bit, but are still only a bit under their preseason projections.  Their decline this past week dropped them out of the TPI-based wild card, which now goes to the Cubs.  The Braves also faltered badly, although I like the Juan Uribe trade quite a lot for the Braves...short term, at least.

Meanwhile, the big risers were the Pirates.  They've been on a tear lately, climbing over .500 for the first time in a long time, and now just two games behind the Cubs.  It would be kind of neat to see those two teams ultimately claim the two NL wild cards, although the Giants certainly will have something to say about that.

Thursday, May 21, 2015

Cleveland Indians Series Preview

Michael Brantley leads Cleveland's offense, but watch out for their pitching.
Photo credit: Keith Allison
The annual "Battle for Ohio" begins tomorrow night.  In the past, this has sometimes been a battle between two legitimate contenders.  Or, at the minimum, a battle between a legitimate contender and a team that is trying to get back in the race.  This year, it's a battle between two disappointments.  How's that for a headliner?

This preseason, the Indians were a fairly trendy pick as a team on the rise.  They have fascinating talent in the starting rotation and a mix of talented youth and veteran position players.  So far, at least, it just hasn't come together.  A lot about how you evaluate this team will come down to how you evaluate players.  The starting rotation, in particular, has put up extremely strong peripherals...but their actual results haven't been pretty.  You don't see a split of almost 50 points between ERA- and xFIP- on a team level very often this deep into a season, but that's what the Indians are dealing with thus far.  Their fielding rates out as pretty bad, which I think was expected, but not so bad to explain that kind of split.  Most of the time, when players show these kinds of numbers, one can predict a significant rebound.

Their position players have hit pretty well so far, though probably not enough to really overcome their fielding struggles.  The team has some interesting ideas in their roster construction, however, which I'll mention below.

Despite the poor start, the projection systems still like Cleveland to improve.  And they've been playing better of late; less than a week ago, they were a sub-0.400 team.  As a result, they still have legitimate playoff aspirations.  This is bolstered by the fact that their top-shelf catcher Yan Gomes is apparently getting closer to a return.  That will be a nice shot in the arm for this team.

Position Players


The thing I like about the way the Indians have constructed their roster is that there really aren't any wasted spots.  While we likely won't see it, because the Reds don't have any left-handers in the rotation, they are currently doing a platoon that gets Mike Aviles and Ryan Raburn in the lineup against lefties.  Aviles, in particular, can play just about anywhere.  The catcher spot is always a shared position.  And David Murphy has almost always been a legitimate offensive threat, especially against right-handed pitchers, and has been important as they weathered Nick Swisher's absence earlier this year.  The result is that they can mix and match their players, taking advantage of platoon advantages, and (ideally) putting their players in the best possible situation to succeed.

This is the kind of thing that the Rays and the Athletics have been doing in recent years, and I think it's something we'll continue to see with teams; they'll treat fewer and fewer players as "starters," and instead use platoons to simultaneously leverage their talent, keep players fresh, and ensure a solid bench.  You have to invest more in your "bench" players this way, but you also don't really have to pay for starters.  You can can hide guys who can't hit same-handed pitching by pairing them with an opposite-handed player who has the opposite problem.  You don't need guys to be everyday players when they can be platoon assets.  It's sort of the opposite strategy to what the Reds have been doing under Jocketty.

Other things: Jason Kipnis seems to be back.  Michael Brantley exploded last year as a 6-fWAR player after many years as a post-hype sleeper, and, if anything, appears to be even better this year.  I mean, sheesh, here's a thing: he's walking almost twice as often as he's striking out.  He's never really been a patient hitter and has always made good contact, but people are afraid of him now and he's being patient in turn.  And more than that, you just don't see guys with .200+ ISO's and 6% strikeout rates very often.  He just looks amazing.  But most of the rest of the team, save for Ryan Raburn in his platoon role, hasn't hit much yet.

Probable Starters


I'm kind of bummed that we don't get to see Danny Salazar, but the three pitchers the Reds do draw are still really interesting.  Carlos Carrasco looks like a fairly extreme, classic case of a guy who's gotten massively unlucky.  He's talented, and his peripherals are almost as good as Corey Kluber's, but he's been hammered thus far.  Reigning Cy Young winner Corey Kluber had been having a rough season as well.  But two starts ago he struck out 18, and then he followed it up with a second dominant performance earlier this week.  He'll be tough.

Finally, we have the always-fascinating Trevor Bauer.  If you haven't, go back and listen to August Fagerstrom's excellent FanGraphs interview of Bauer from last August.  He has a lot of interesting ideas about how to pitch; once you get past the jargon (which was intially eyeroll-inducing), I thought his specific ideas about how to determine what pitch to throw were really interesting.

As a baseball fan, it's a fun rotation to watch.  As a Reds fan, I'll be hoping to see some improvements from DeSclafani; he's going to have to get his walk rate under control, though my impression is that his stuff has been too hittable when he has gone into the zone of late.  The hits off of him in his last start weren't cheap ones.

Bullpens


Maybe it's because their starters have been hit so hard, but it doesn't seem like there have been a lot of high-leverage innings for this bullpen.  Their main cog, closer Cody Allen, has not had a good season thus far, though he did manage to avoid not messing up Kluber's amazing starter the other night.  I've always liked Marc Rzepczynski.  Maybe it's the name.  Maybe it's because I once drafted him in my deep fantasy league.  But he's the principle lefty threat in their bullpen who is not assigned to mop-up duties.

Wednesday, May 20, 2015

A Comparison of BIS Quality of Contact to StatCast Batted Ball Velocity

Yesterday, I showed that StatCast's Batted Ball Velocity data is correlated, at least, to performance statistics like ISO and HR/FB rate.  We've received another, similar, data source this year: BIS's Quality of Contact ball classifications.  For each batted ball, BIS classifies the balls as either "Hard," "Medium," or "Soft."  They're not recording actual velocity, but these aren't purely subjective either.  They apparently use a combination of hang time and landing spot information to determine the quality of contact category.

So, the question is, how well do these correlate to the (hopefully) more accurate StatCast data?  Pretty well!
If you look across the top row of the matrix, you see Batted Ball Velocity (on y-axis) plotted against Hard %, Med %, and Soft %.  You can see that it tracks very well with Hard Hit Ball %, in particular, and shows a pretty strong negative correlation with Soft %.  This is just as expected, but it's nice to see the data looking pretty solid.

Interestingly, Batted Ball Velocity also tracks negatively with Med %, though it's a weaker relationship; the harder you hit the ball, the fewer medium-hit balls you will make.  Similarly, Hard Hit % is negatively correlated with Med % and Soft %.

Here's a correlation matrix of those data:
BBVelo
Hard %
Med %
Soft %
BBVelo
---
0.660
-0.359
-0.502
Hard %
0.660
---
-0.713
-0.554
Med %
-0.359
-0.713
---
-0.185
Soft %
-0.502
-0.554
-0.185
---

Using Quality of Contact as a Surrogate for Batted Ball Velocity


For seasons prior to this one, where we don't have StatCast data available, it would be really nice to be able to estimate batted ball velocity based on these data.  Unfortunately, given how correlated each BIS variable is with the others, it's hard to use more than one of them in a regression because they introduce multicollinearity and, potentially, don't provide much additional information.  To check, however, I did an all possible subsets regression analysis, using combinations of Hard %, Med %, and Soft % variables to predicted batted ball velocity.  Here's the output:
This is kind of a weird figure, but what it shows is the quality of fit (as measured by adjusted R2 on the y-axis) versus the different possible models (shown on the x-axis).  What we see is that a simple regression predicting Batted Ball Velocity with Hard Hit Ball % alone gives an adjusted R2 of 0.43.  It is, by far, the best of the single-variable models.  Furthermore, adding additional variables provides almost no additional explanatory power (it maxes out at 0.46).  Therefore, our best option is to simply predict Batted Ball velocity using Hard %.

If you'd like to do this at home, this is the regression equation: Velocity = 80.69 + 26.6842 * Hard %

This will give you a pretty solid fit:
R2 = 0.43.  It looks like, most of the time, you'll be within about + 5% of the actual batted ball velocity using Hard %.  Maybe it gets better with larger samples; well see later in the season.

But hey, something is better than nothing! Right now, this gives us a basic format that will permit us to look at quality of contact in seasons prior to 2015.  And, like Batted Ball Velocity, Hard % tracks pretty well with variables like ISO and HR/FB...and, like BB Velocity, it does NOT track well with BABIP:
So, in short, while I love using actual velocity data, the Quality of Contact Data--and particularly the Hard % data--provided by BIS looks to be high quality and very usable.

Next up (probably): more of this stuff, but applied to Reds hitters

Tuesday, May 19, 2015

Batted Ball Velocity Data Predicts Performance

Jay Bruce leads the Reds with 92 mph Batted Ball Velocity,
but his ISO and HR/FB rates a just middle of the pack.
Photo credit: Trev Stair
We've long known that random events can influence hitters' batting lines.  We'll see Jay Bruce crush a ball to deep center field only to see it caught.  And then, the next batter, we'll see Brandon Phillips bloop a "dying quail" over the second baseman's head for a single.  Probably, we'd expect that a hitter's future results will relate better to how hard he hits the ball, rather than his past "luck" in "hitting it where they ain't."

The advent of StatCast batted ball velocity data in the gameday feed is an exciting development in that, for the first time, we have a direct measure of how hard hitters are striking the ball.  The data are still a bit hard to come by; our best source is at Baseball Savant, who scrapes the data together from gameday.  I know others have worked with these data already, but what follows is my first foray into analysis using these data.

Describing batted ball velocity data

I pulled average batted ball velocity data for all players in Savant's database using the link above.  One can do more specific comparisons using his pitchf/x search tool, but I was happy with overall average velocity for a first look (that said, I have no doubt that variation in his number is extremely important).  I linked this up, by name, to hitters from FanGraphs' database.  All data were through May 17, 2015.  Many thanks to these two sites for the data.

After culling out anyone who did not have velocity data, I then stripped down the sample to those with 60 PA or more.  It seemed like a good mid-range number.  That left 291 players in my dataset.  Here's a histogram of their velocity data:

The average batted ball velocity in this set of players was 88.5 mph, and you can see that the distribution is almost perfectly normal.  Very few major league hitters average over 95 mph, and very few average under 82 mph.  The latter is probably a selection process; if you don't hit the ball harder than that, you're not likely to be in the big leagues for long.

How well does batted ball velocity predict offensive numbers?

It seemed to me that there were three primary variables that should be most directly affected by batted ball velocity:

  • BABIP: the harder one hits the ball, the more balls in play should fall in as hits.  
  • ISO: the harder one hits the ball, the more extra bases you should gain.
  • HR/FB: the harder one hits the ball, the more often fly balls should become home runs.
I didn't look at overall performance statistics, like wOBA or OPS, because those numbers will be affected by non-contact events (strikeouts & walks).  Any affect on those summary numbers will occur specifically due to changes in the above statistics.

Let's go through those one by one.

Batting Average on Balls in Play (BABIP)
As it turns out, there was no significant effect of batted ball velocity on BABIP (P = 0.06, R2 = 0.012).  This really surprised me.  But maybe there is some signal that is lost in the overall comparison?  For example, maybe batted ball velocity is better for fly ball hitters, but is worse for ground ball hitters who are trying to beat out infield hits.  

Therefore, I decided to split up my hitters into three groups:
  • Ground Ball Hitters: - hitters who had a ground ball % in the upper quartile of the data (a GB% greater than 50%)
  • Fly Ball Hitters: hitters who had a ground ball % in the lowest quartile of the data (GB% less than 39.3%).
  • Non-GB Non-FB Hitters: hitters who were in the two middle quartiles of the data.
Here's what happened:
Neat, right?  When you look at fly ball hitters, average batted ball velocity does predict BABIP, at least a little bit (p = 0.008, R2 = 0.07).  But there's no relationship for other hitters.  

I guess the lesson here is that BABIP is still a pretty volatile statistic, with other factors (luck/fielding/pitchers/parks/weather) playing a large enough role that it masks any potential effect.  Or, perhaps we need to be even more nuanced; maybe ground ball-speed guys, like Dee Gordon, might have a different relationship with batted ball velocity than ground-ball slow guys?  It's a topic for future study.

Also, another fun thing: there's not really much difference in BABIP between the different hitter types.  FB Hitter = .289,  GB Hitter = .305, Middle 50% Hitters = 0.302.  Compared to the spread in the data, that's not much of a difference.  ....  although it probably matters more in larger samples.

Isolated Power (ISO)

Isolated power (which is SLG - AVG) is a measure of how many of one's hits result in extra bases.  Here's the overall trend:
Batted Ball Velocity does predict isolated power (p < 0.0001, R2 = 0.22).  Here's the breakdown by hitter type, as I did for BABIP:

It looks like the relationship is pretty consistent across hitter types.  The one caveat is that the more fly balls you hit, the higher your ISO and the higher your slope.  In other words, by hitting fly balls, you are going to get more extra bases.  And increasing batted ball velocity results in a more extra bases if you're hitting fly balls than if you're hitting ground balls.  That all makes sense, I think.

Home Run per Fly Ball Ratio (HR/FB)

One more: does hitting the ball harder result in more home runs per fly ball?  For this one, I removed anyone from the dataset who hadn't yet hit a homer...because I don't like 0's when running regressions.
While HR/FB is a notoriously volatile number, even for hitters, there is a significant relationship once again (p < 0.0001, R2 = 0.19).  And if we break down by hitter type:
...much the same story.  Interesting thing with the ground ball hitters, though: despite mostly-similar batted ball velocity, their fly balls turn into home runs at a lower rate than the dedicated fly ball hitters.  This must be a swing angle effect; fly ball hitters probably use an upper-cut swing, and therefore will hit the ball hard and in the air, which converts into home runs.  In contrast, if ground ball hitters have more of a level swing, when they hit it in the air it is likely to be a mistake, and not among their harder-hit balls.  As a result, they turn into outs rather than home runs more often.

Can we predict future regression based on batted ball velocity?

So, we have two variables that are predicted well by batted ball velocity: ISO and HR/FB.  Can we predict players who will regress (positively or negatively) in these statistics based on how hard they've hit the ball thus far?

Let's look at isolated power first.  Here is a graph showing residual ISO (the difference between actual and expected ISO values, based on our regression line) of a bunch of players:
It's messy, but at least you can make out the guys on the extremes.  Players near the top of the graph have higher isolated power than their average batted ball velocity would predict.  In contrast, players with a residual below 0.0 show improvement in their ISO.

Here's a list of the largest residual players:
So, yes, of course the guys who are expected to decline have high ISO's, and the guys expected to improve have low ISO's.  But we've got more precision than just a sort of ISO now.  Giancarlo Stanton, for example, has an ISO of 0.293 currently, and yet he hits the ball so hard that his residual is only slightly positive.  Similar things can be said about Joc Pederson.  On the other side of the coin, Jordan Schafer, Cesar Hernandez, and Ichiro Suzuki all hit the ball very lightly, and so their low ISO's (0.04-0.06) all seem very appropriate.

I don't want to overstate the effect, but this should help us anticipate player who will regress.

Also: Grady Sizemore is playing this year?  I had no idea.

Now, let's do HR/FB:
Again, higher residuals = better HR/FB than expected based on batted ball velocity.  Here's the players who stand out:
Again, we have more information here than just picking the highest and lowest HR/FB guys.  Giancarlo Stanton hits the ball really hard and has a high HR/FB, and this is not disputed by the regression.  Ichiro and Billy Hamilton are at the low end, and that doesn't seem strange.  But when there's a mis-match between HR/FB and BB Velocity, they show up on this chart.

So, maybe we can make better predictions now.  That said, I think a lot more would need to be done before this is ready for any kind of "real" use (in fantasy baseball, or otherwise).  A lot of the guys on the "probably will regress" list are fly ball hitters, and therefore we'd expect a higher HR/FB as a result.  A lot of guys on the "probably will improve" list are ground ball hitters.  At the least, if we're trying to project, we need to take that into consideration.  I'm just not there yet.

Nevertheless, I think this is promising enough that I just put a reminder in my planner to go back and check on this at the start of July and see how we did, compared to players who had similar HR/FB or SLG but had corresponding batted ball velocity.

Next up: how does StatCast batted ball velocity data compare to the BIS Hard-Hit ball data?

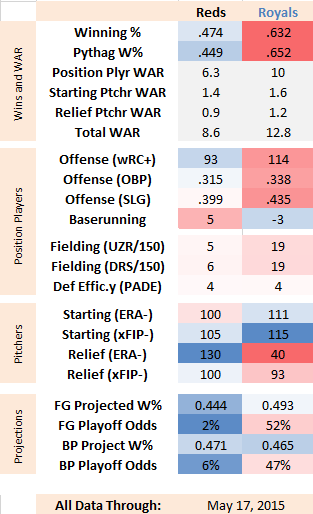
Series Preview: Reds at Royals

To kick off the week, the Reds travel to last year's postseason sweetheart team, the Kansas City Royals for a short, two-game series.  The story on last year's Royals seemed pretty clear: they were a decent, not-great team that squeaked into the playoffs and got hot at just the right moment.  They got a lot of attention for their ability to leverage their excellent bullpen in the postseason, but the real story, for me, was the explosion of their offense in October, which had been below-average all year (94 wRC+).  This year, however, most prognosticators, and most projection systems, expected them to regress back to a 0.500 ballclub.

That clearly hasn't happened.  The Brawling Royals have instead been an offensive juggernaut, tying the Tigers as the second-best offense in baseball behind the Dodgers by wRC+.  They're getting on base, but more surprisingly, they're hitting for extra bases.   Aside from one player, their lineup is virtually identical this year to the 2014 team, which posted the LOWEST home run total in baseball.  They're slightly better this year in that department, but mostly their extra bases are coming in the form of doubles: they lead the majors with 82.  Oh, fun thing: the Reds trail the majors with 38.

If there's a weakness to the Royals, it's their pitching.  Their bullpen has been superb thus far (by results, at least), but their rotation has been shaky.  Some have speculated that they might be a good trading partner for a team that has minimal prospects of making the postseason and viable starting pitching options who are approaching free agency.  Anyone know a team like that?


Position Players

About 5 years ago, the Royals had the best farm system in baseball.  In fact, it was not just the best, but it was described as "the best farm system in recent memory."  Alex Gordon, after several false starts, has turned into a legitimate star.  But two of the other cogs in their plan, Eric Hosmer and Mike Moustakas, were starting to look like busts.  After a good first full season in 2012, Moustakas seemed to be fizzling, and last year was sent to the minors mid-summer in a desparate hope to jump-start his career.  Eric Hosmer was arguably worse.  He had a good year in 2013 (3.2 fWAR), but was otherwise a replacement player (or worse!) in 2011-2012, and 2014.

This year, however, they've been outstanding.  Hosmer is walking for the first time in his career, has a .400+ OBP, is generating tremendous extra base hit totals.  Moustakas will probably never be a patient hitter, but this year has shown dramatically improved contact rates and is spraying the ball to the opposite field 50% more often than in prior years.  Lorenzo Cain, who is perhaps better know for his defense, is also hitting well, and they've been bolstered by a resurgent Kendrys Morales.  The only weak spot in their lineup is Jarrod Dyson, pinch-runner extraordinaire, who is filling in the the injured Alex Rios.  I don't know if this will continue, but thus far the Royals have been a legitimately outstanding offense.

Probable Starters

We only get two games against the Royals, but one, at least, features the fascinating Yordano Ventura.  Thus far in his young career, the 24-year old Ventura has yet to post the high strikeout numbers his superb velocity would seem to predict.  This year, however, he's shown considerable improvement in his ground ball rate, giving him at least one excellent component.  I like him a lot, despite middling results thus far.

Jeremy Guthrie, on the other hand, basically just looks old.  He's never been a good strikeout guy, but he currently has the lowest strikeout rate among all qualified pitchers.  He's also a fly ball machine.  Yeah, he doesn't walk anyone.  Doesn't much matter with those numbers.  If you like high-scoring baseball, the Guthrie/Marquis match-up looks like a dandy.
\
Bullpens

Both teams are currently sporting rather full bullpens due to the fairly restful period in the bullpen.  The Royals' collective ERA has been ridiculous.  Their peripherals have been less so, though I'm pretty intrigued by what former-Red, doomer-of-Chapman-to-Pen Ryan Madson has done.  Wade Davis still hasn't allowed a run, and has been phenomenal.

Reds note: Jumbo Diaz is the only non-Chapman reliever with a sub-100 xFIP-...of course, his ERA- has been brutal.  He's been pitching pretty well, though, aside from the occasional homer allowed.  It's frustrating, as he's getting ground balls at a good rate, and his strikeout-to-walk rates have been phenomenal.